
Intro 🔗
This is part three of a mini series on my journey to build my own blogging site without using WordPress or any blogging site like Tumbler or Medium. I want full control of my published thoughts. This includes if and how I should share my data with advertisers and crawlers.
History 🔗
I remember the days when you had to print console statements in your code to troubleshoot odd behavior. When you needed to dig into the variables and insides the functions and scopes. As long as there was a developer console I could see the output, I was good to go.
However, this left a few undesirable “features” in the code. Either you wrote a custom error function that you could turn off using a global variable… Or, you had to go back through and manually remove all those print statements to clean-up the code before pushing to production.
If you opted for the custom error function (or class), then you ended up with bloated code that consumed memory overhead — even if it wasn’t used.
Setup the IDE 🔗
Now, you can simply forego the print statements and inspect the in-memory variables inside VScode. (You still need to output “user errors,” however.)
Extensions 🔗
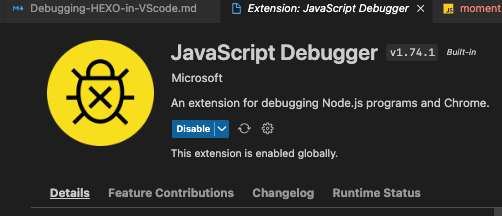
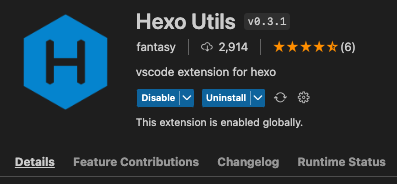
You need to have JavaScript Debugger and Hexo Utils extensions installed.
launch.json 🔗
In addition to installing the extensions, you’ll need to configure the debugger in VScode. Below is the basic config recommended to add:
📖 Find the attribute definitions here: https://code.visualstudio.com/docs/editor/debugging#_launchjson-attributes
{
  // Use IntelliSense to learn about possible attributes.
  // Hover to view descriptions of existing attributes.
  // For more information, visit: https://go.microsoft.com/fwlink/?linkid=830387
  "version": "0.2.0",
  "configurations": [
      {
          "type": "node",
          "request": "launch",
          "name": "HEXO server",
          "program": "${workspaceFolder}/node_modules/hexo-cli/bin/hexo",
          "args": [
              "server",
              "-p 4000"
          ],
          "restart": true,
          "runtimeExecutable": "node",
          "runtimeArgs": [
              "--inspect"
          ],
          "stopOnEntry": true,
          "sourceMaps": true,
          "cwd": "${workspaceFolder}"
      },
      {
          "type": "node",
          "request": "launch",
          "name": "HEXO generate",
          "program": "${workspaceFolder}/node_modules/hexo-cli/bin/hexo",
          "args": [
              "generate"
          ],
          "sourceMaps": true,
          "cwd": "${workspaceFolder}"
      }
  ]
}
Take this file and save it to ~/project/.vscode/launch.json. This is where VScode will look to find the debugger config. (Replace the /project folder with the root of your project.) You may also wish to update your .gitignore file if you don’t wish to publish to your repo. In my case, I want the team to benefit from the same config, so I leave it in.
Debug it within the IDE 🔗
Now that we have the extensions and config setup, it’s time to start debugging Hexo.
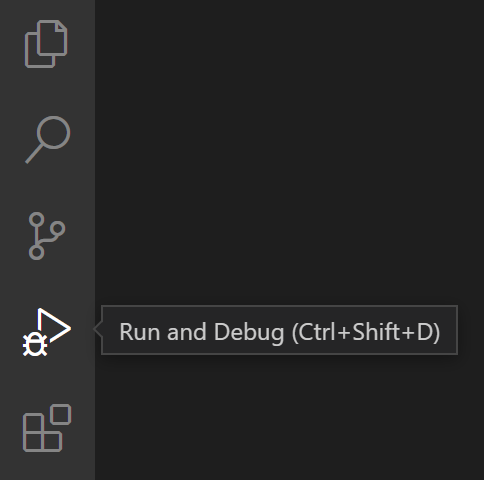
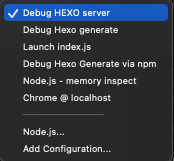
Click on the Run and debug icon (shift + command + D) and from the VScode debugger side-panel, select Debug HEXO server from the drop-down options.
stopOnEntry option, it will pause the code after starting it. However, it’s also a good idea to create your breakpoints within your code to troubleshoot it faster.Now tap F5 to start the debugger.
Stepping through the Matrix 🔗
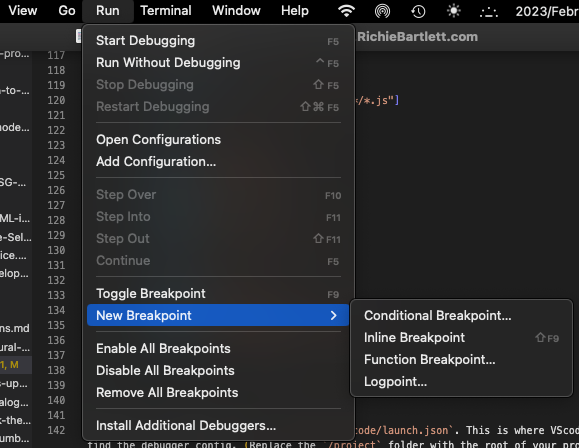
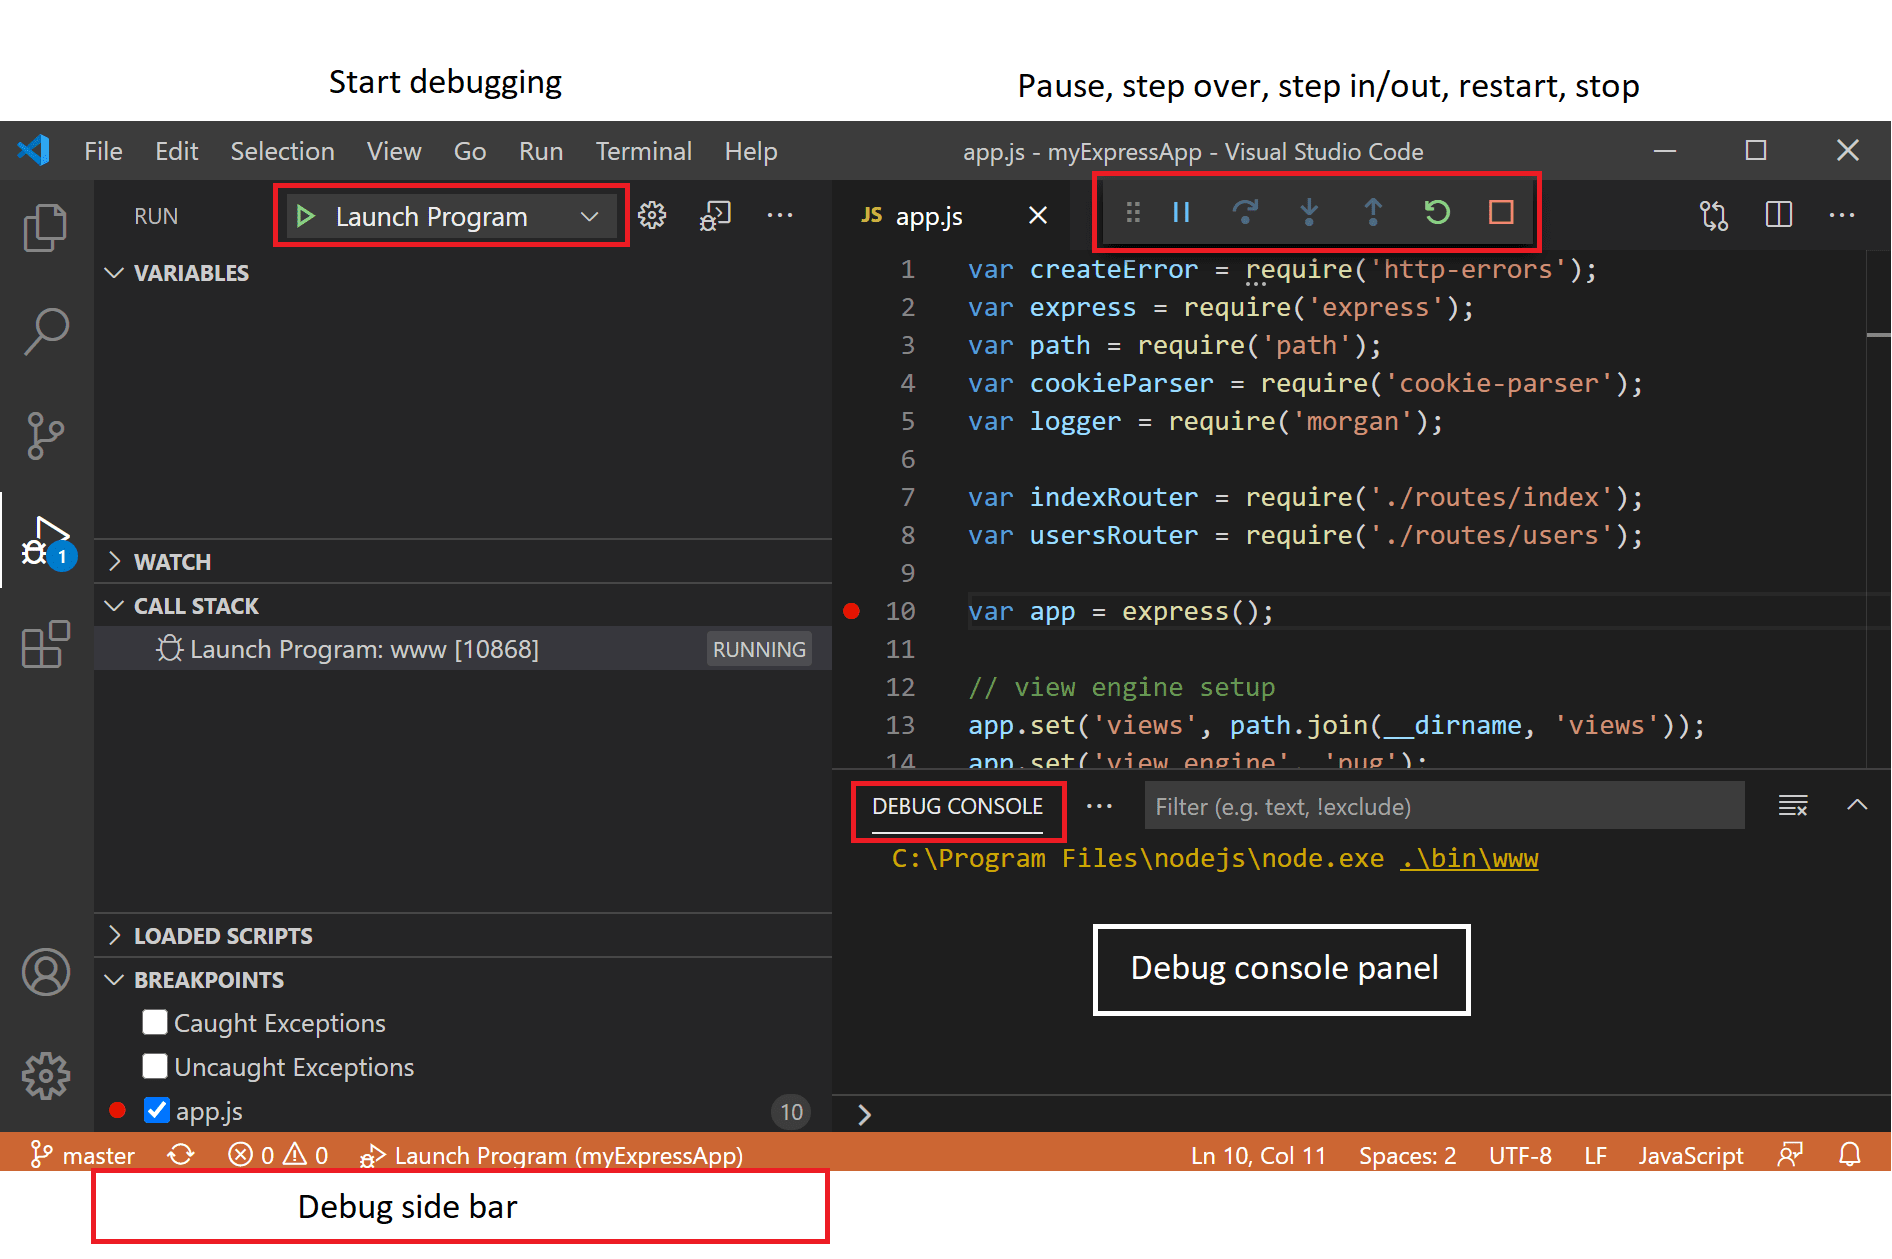
You should see a toolbar at the top of VScode. Each of these buttons are defined below.


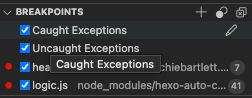
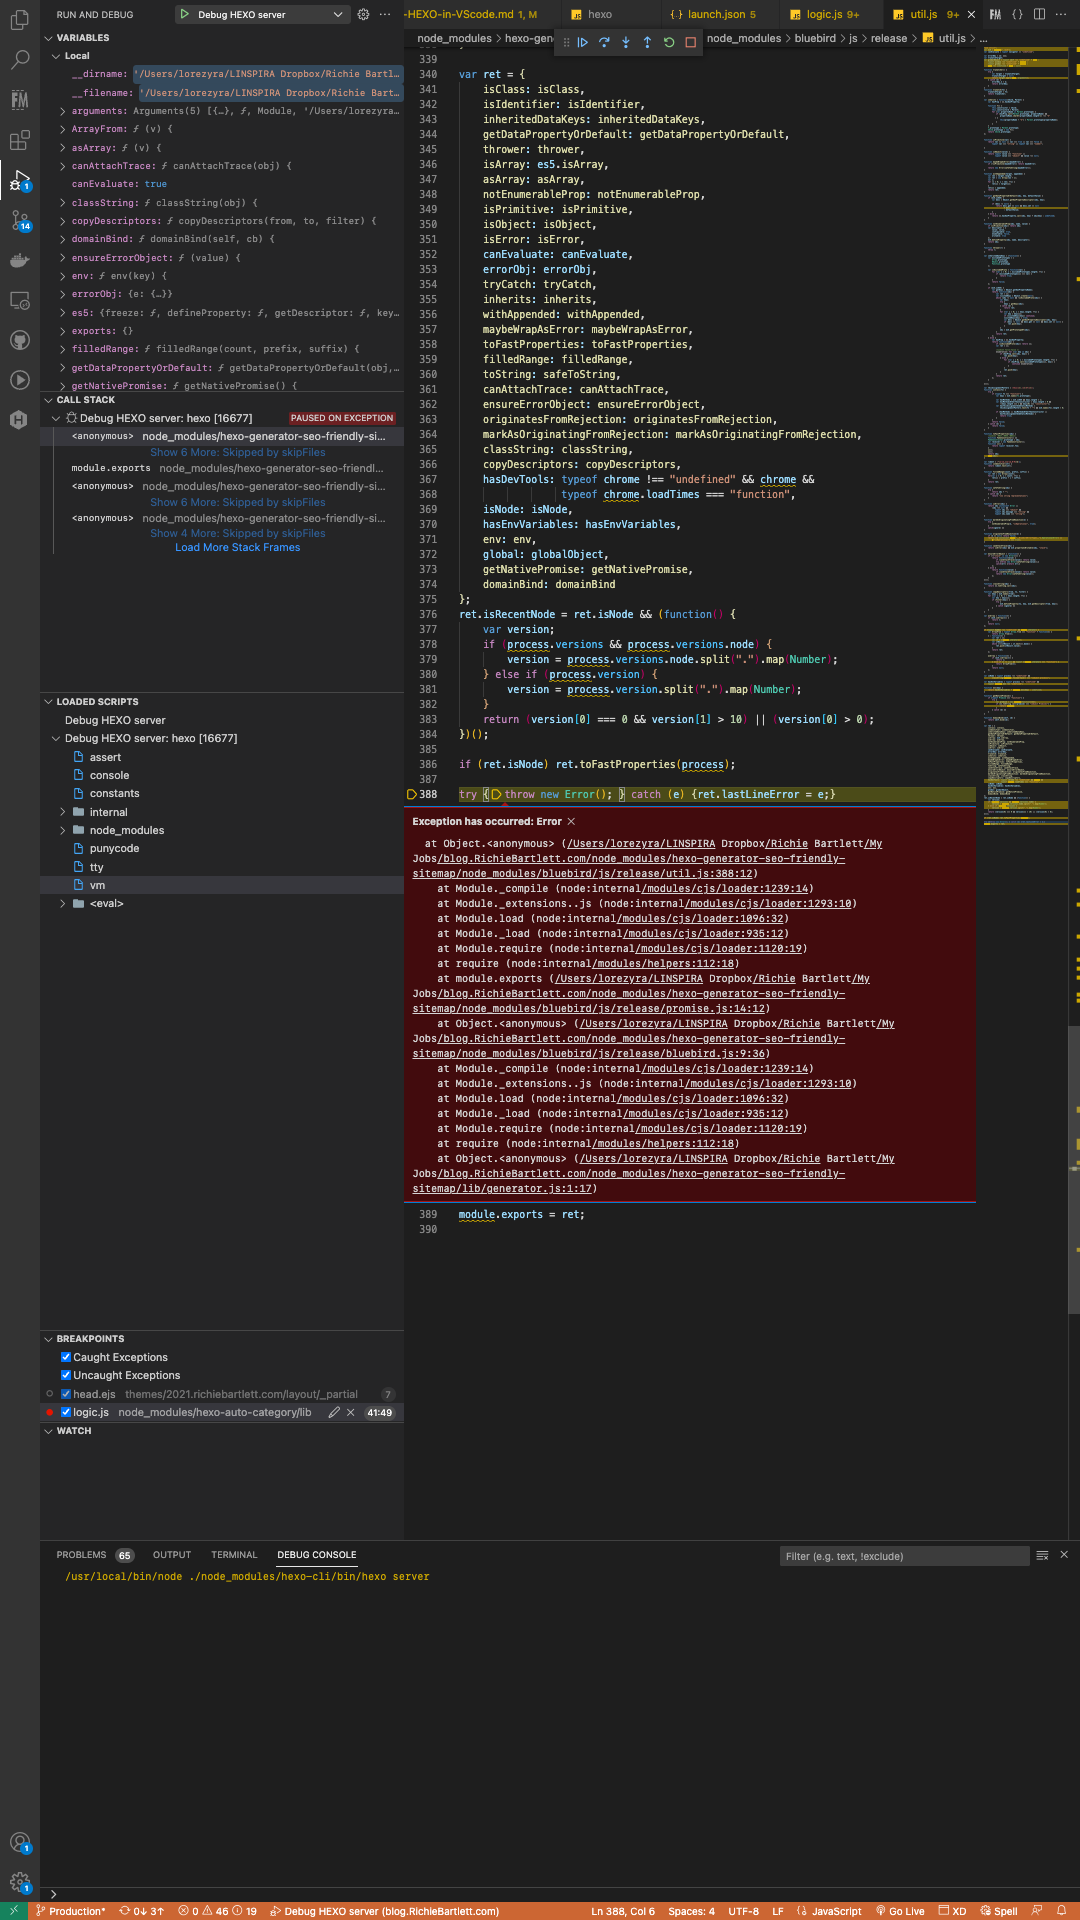
Be sure to check the options for Caught Exceptions and Uncaught Exceptions.
You should see something similar to this:
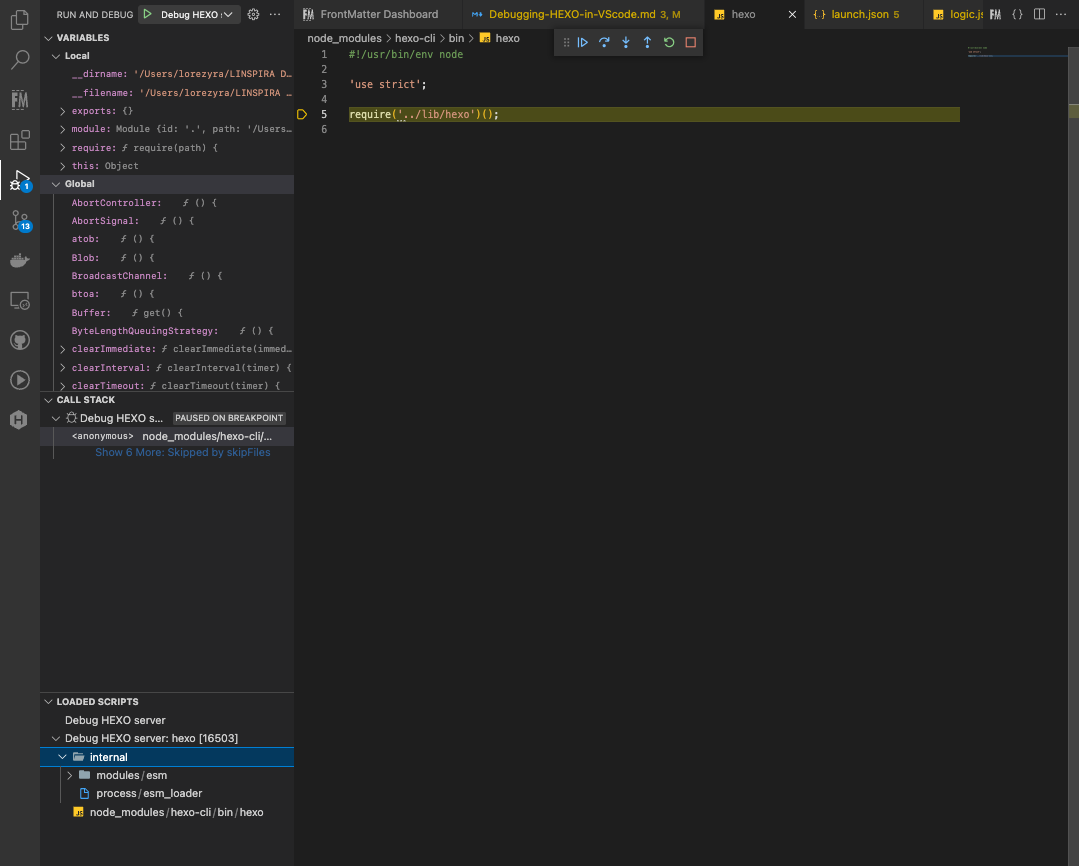
From here, you can start to step through the code and troubleshoot its behavior. In the Variables panel, you can review the current status of values (and functions). The Call Stack panel displays the list of functions that are called (most recent is at the top). Loaded Scripts shows all the modules called by HEXO. Watch is where you can add variables to see changes within the current context or scope of the function you are stepping through. And, if you are outputting anything to the Debug Console, it would show up at the bottom of the screen.
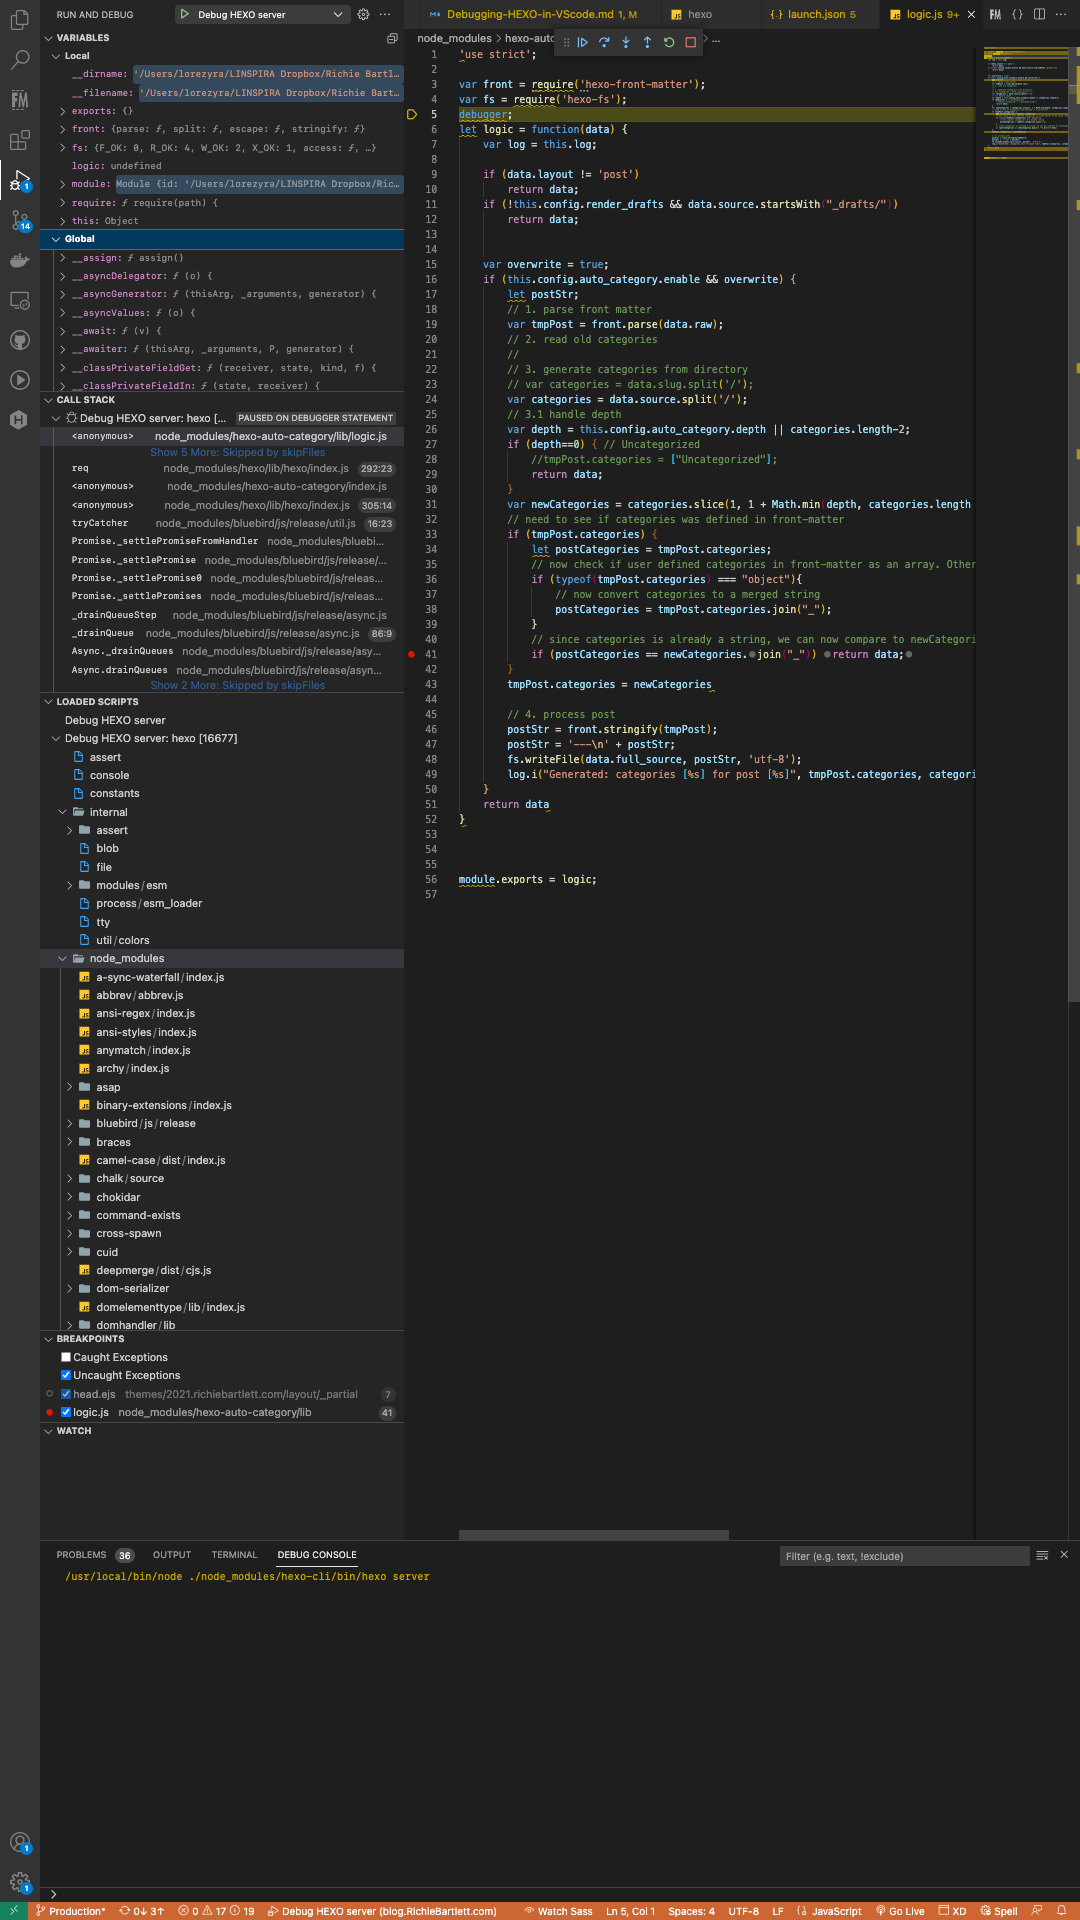
As you can see, VScode makes it easy to dive deeper into the code and follow along. Additionally, you can learn how the code works faster by reviewing the Global variables and functions in the Variables panel. Watch the Call Stack to see how functions are called.
In the code, you can hover your mouse above a variable to see its value. Additionally, you can add it to the Watch panel to see how it changes over runtime.
🎥 Debugging a Hexo plugin | Video (19:06 minutes)
Debugging the Theme 🔗
The above illustrates how to debug the JS files in the node_modules folder (and your HEXO plugins)… However, VScode doesn’t step through your (EJS) theme files by default. To achieve that, you must attach the debugger to the NodeJS process.
First, add the following configuration block to your launch.json file.
  {
      "type": "node",
      "name": "Hexo Theme inspector",
      "request": "attach",
      "program": "${workspaceFolder}/node_modules/hexo-cli/bin/hexo",
      "args": [
          "server",
          "-p 4001",
          "--debug"
      ],
      "runtimeExecutable": "node",
      "runtimeArgs": [
          "--inspect=4001"
      ],
      "processId": "${command:PickProcess}",
      "protocol": "inspector",
      "address": "localhost",
      "port": 4001,
      "restart": true,
      "sourceMaps": true,
      "outFiles": [
          "${workspaceFolder}/**/*.js"
      ],
      "localRoot": "${workspaceFolder}",
      "remoteRoot": "${workspaceFolder}",
      "cwd": "${workspaceFolder}",
      "console": "internalConsole"
  }
Second, run the following command from within the terminal console of VScode.
hexo clean && node --inspect-brk=4001 $(which hexo) server -p 4001
Next, select Hexo Theme inspector from the dropdown of the debugger panel. Click the green run button. You will be prompted to select the nodeJS process for HEXO.
You should see “Debugger listening on …” and “Debugger attached.”
🎥 Walk-through on Debugging Hexo in VScode | Video (11:50 minutes)
Performance Monitoring 🔗
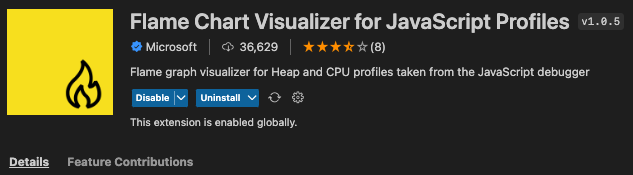
For analyzing the performance of your HEXO (plugin) project, you’ll need to add another extension to VScode. Flame Chart Visualizer for JavaScript Profiles
While running or debugging a JavaScript debug target (a launch type of node, chrome, msedge, extensionHost, or their pwa- prefixed versions), the realtime performance view is shown in the Debug view:
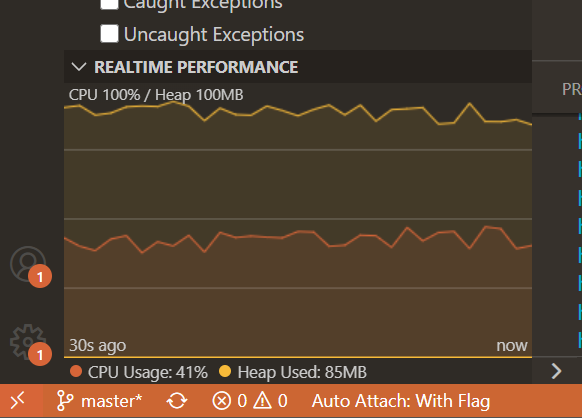
By default, this view shows chronological “snapshots” of your program’s stack taken roughly each millisecond. You can zoom and explore the flamechart, and ctrl or cmd+click on stacks to jump to the stack location.
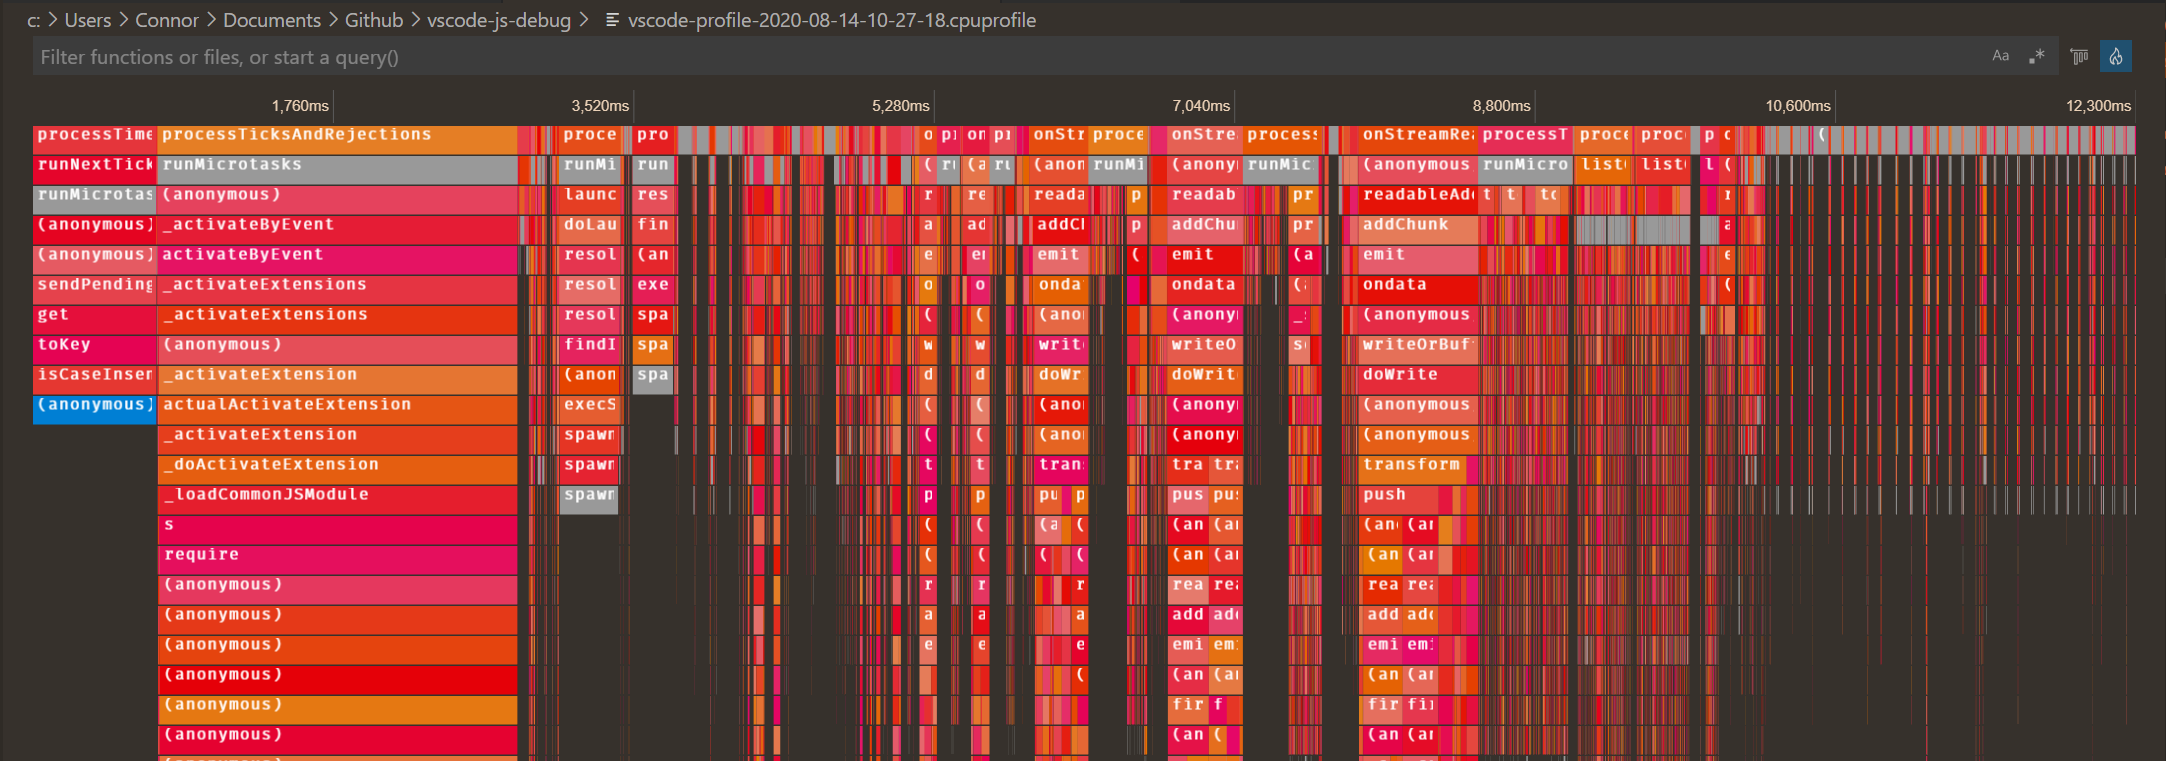
The flame chart also supports a “left heavy” view, toggled by clicking the button in the upper-right corner of the chart.
Other troubleshooting tools 🔗

🎥 Demo of Node Clinic with Matteo Collina | Video (12:07 minutes)
Reference 🔗
- Troubleshooting HEXO
- Debugging HEXO
- Debug Hexo with VS Code
- Node.js debugging in VS Code
- Browser debugging in VS Code
- Node.js Development with Visual Studio Code
- Performance Profiling JavaScript
- How to debug/inspect hexo blog
- VSCode: Debugando módulos instalados em node_modules
- Debug hexo blog generation in webstorm
- how can I debug a node app that is started via the command line (cli) like forever or supervisor?
- 🎥 Are you debugging JavaScript in VSCode? | 7:05 minutes
- 🎥 How to Use a Debugger - Debugger Tutorial | 17:00 minutes
- 🎥 Debugging in Visual Studio Code Tutorial | 6:25 minutes
- JavaScript Debugger - VScode Extension
- Debugging Node.js apps with Visual Studio Code debugger
- Node.JS Debugger documentation
- Unbound breakpoint in vscode for debugging nodejs app
- Absolute Easiest Way to Debug Node.js - with VS Code
