
Previously, I discussed the IPCC Sixth Assessment Report on my blog. The report outlines the dramatic changes we must put into action within a few short years before we lose our window of opportunity. Part of the problem, in my view, is that most have a hard time understanding the scope of how energy is consumed and where that source is from and it’s applications. Additionally, your average citizen seems unaware that our governments are complicit in the consumption of our planet despite the dire collapse we face with Global Warming. Indeed, it seems that are politicians are incentivized in ignoring the problem.
Below I will share some visual representations of the scope in hopes of illuminating the size of our problems (and political addictions).
Trillions in Fossil Fuel Subsidies 🔗
With energy consumption vital for life and business, governments often look to fossil fuel subsidies to make energy as affordable as possible.
These subsidies artificially reduce the price of fossil fuels and generally take two forms:
- Production subsidies occur when governments provide tax cuts or direct payments that reduce the cost of producing coal, oil, or gas.
- Consumption subsidies cut fuel prices for the end-user through price controls and other such measures.
Each year, governments around the world pour nearly half a trillion dollars into fossil fuel subsidies. This chart breaks down a decade of fossil fuel consumption subsidies by energy source using data from the International Energy Agency (IEA).
Breaking Down Fossil Fuel Consumption Subsidies 🔗
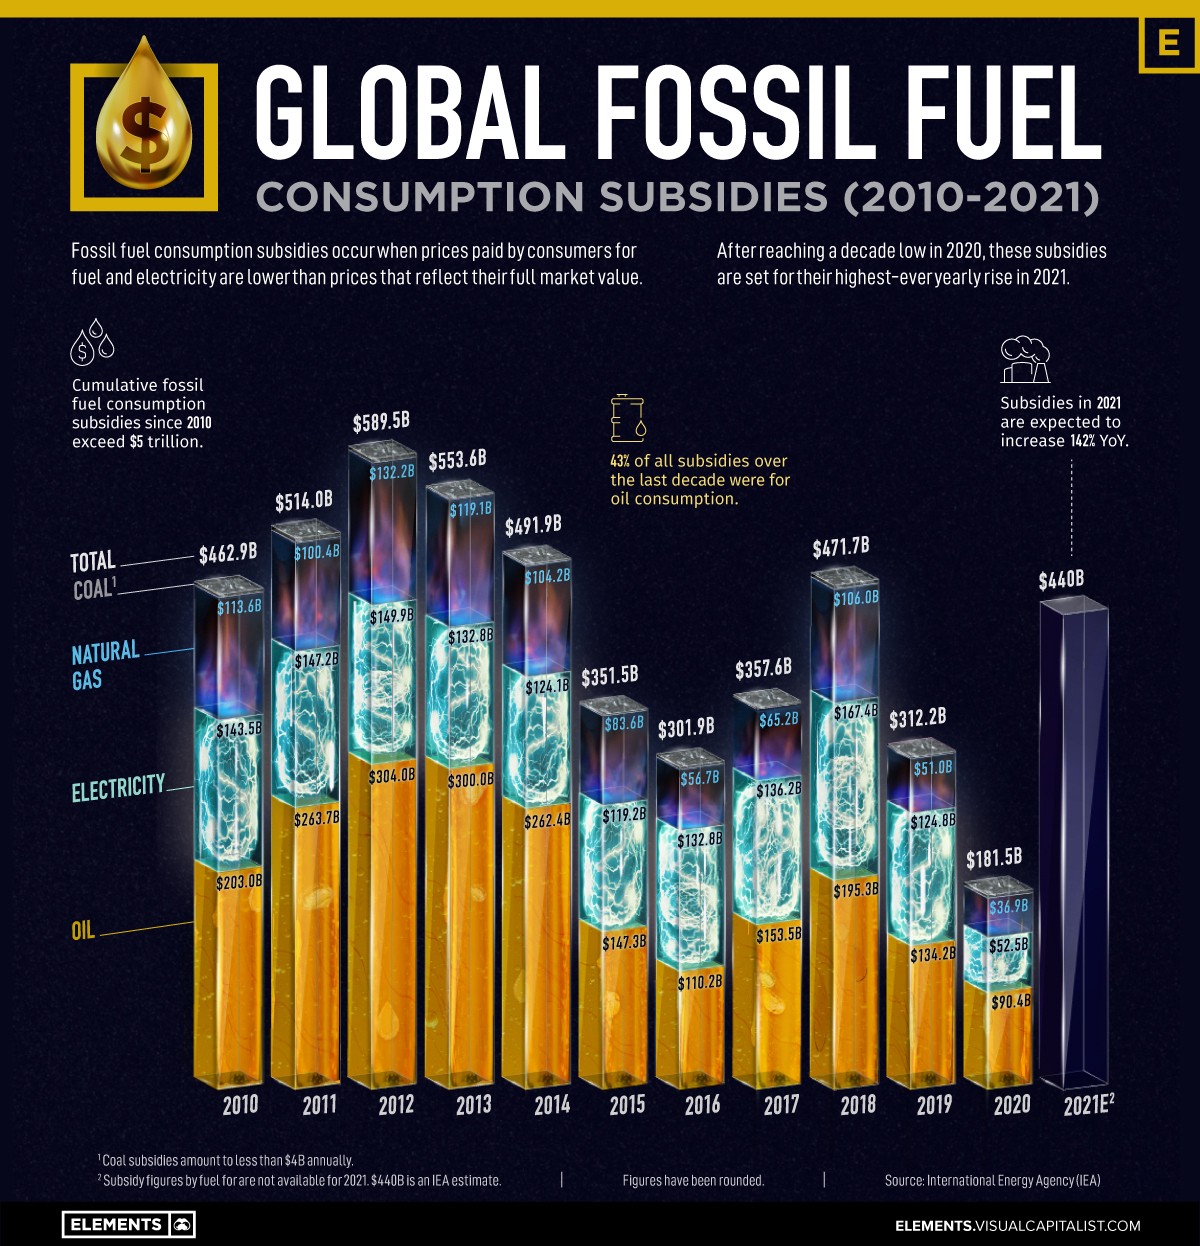
Since 2010, governments have spent over $5 trillion in fossil fuel consumption subsidies. The majority of this sum went towards making oil more affordable, as seen below:
Subsidies by Year (US$)
| Subsidies by Year (US$) | Oil | Electricity | Natural Gas | Coal* | Total |
|---|---|---|---|---|---|
| 2010 | $203.0B | $143.5B | $113.6B | $2.7B | $462.9B |
| 2011 | $263.7B | $147.2B | $100.4B | $3.6B | $514.0B |
| 2012 | $304.0B | $149.9B | $132.2B | $3.3B | $589.5B |
| 2013 | $300.0B | $132.8B | $119.1B | $1.7B | $553.6B |
| 2014 | $262.4B | $124.1B | $104.2B | $1.1B | $491.9B |
| 2015 | $147.3B | $119.2B | $83.6B | $1.5B | $351.5B |
| 2016 | $110.2B | $132.8B | $56.7B | $2.2B | $301.9B |
| 2017 | $153.5B | $136.2B | $65.2B | $2.7B | $357.6B |
| 2018 | $195.3B | $167.4B | $106.0B | $3.0B | $471.7B |
| 2019 | $134.2B | $124.8B | $51.0B | $2.2B | $312.2B |
| 2020 | $90.4B | $52.5B | $36.9B | $1.7B | $181.5B |
| Total | $2,164.0B | $1,430.4B | $968.9B | $25.7B | $4,588.3B |
Fossil fuel subsidies fell to a decade low in 2020 as the pandemic hampered fuel consumption and triggered a nosedive in oil prices. However, after two years of straight declines, the IEA estimates that governments around the world spent $440 billion on subsidizing fossil fuel consumption over 2021, representing a 142% rise year-over-year.
Breaking down the subsidies by fuel, oil accounts for 43% or over $2 trillion of all subsidies between 2010 and 2020. Together, oil and electricity generated by fossil fuels received nearly 75% of all subsidies.
Despite growing support for the clean energy transition, the fossil fuel industry reaps the benefits of billions in subsidies annually — but why?
Why Do Governments Subsidize Fossil Fuels? 🔗
High energy prices can have rippling effects throughout an economy.
For consumers, heating and transportation become more expensive. And for producers who use energy and oil as inputs, the cost of goods and services goes up.
Often, governments turn to energy subsidies to keep prices down and encourage economic activity. Therefore, there’s a high cost to removing these subsidies, especially in developing countries where large parts of the population might lack access to affordable energy.
But fossil fuel subsidies can also have detrimental effects. By artificially lowering prices, they can encourage overconsumption of carbon-intense fuels, creating negative externalities through adverse environmental and health impacts. According to the International Renewable Energy Agency, these add up to an amount anywhere between $2.6 to $8.1 trillion globally.
Despite these disadvantages, fossil fuels remain an important part of the global energy mix, with continued support from governments. And with energy prices soaring, 2022 could be another year of billions in fossil fuel subsidies.
What do we use oil for? 🔗
From the gasoline in our cars to the plastic in countless everyday items, crude oil is an essential raw material that shows up everywhere in our lives.
With around 18 million barrels of crude oil consumed every day just in America, this commodity powers transport, utilities, and is a vital ingredient in many of the things we use on a daily basis.
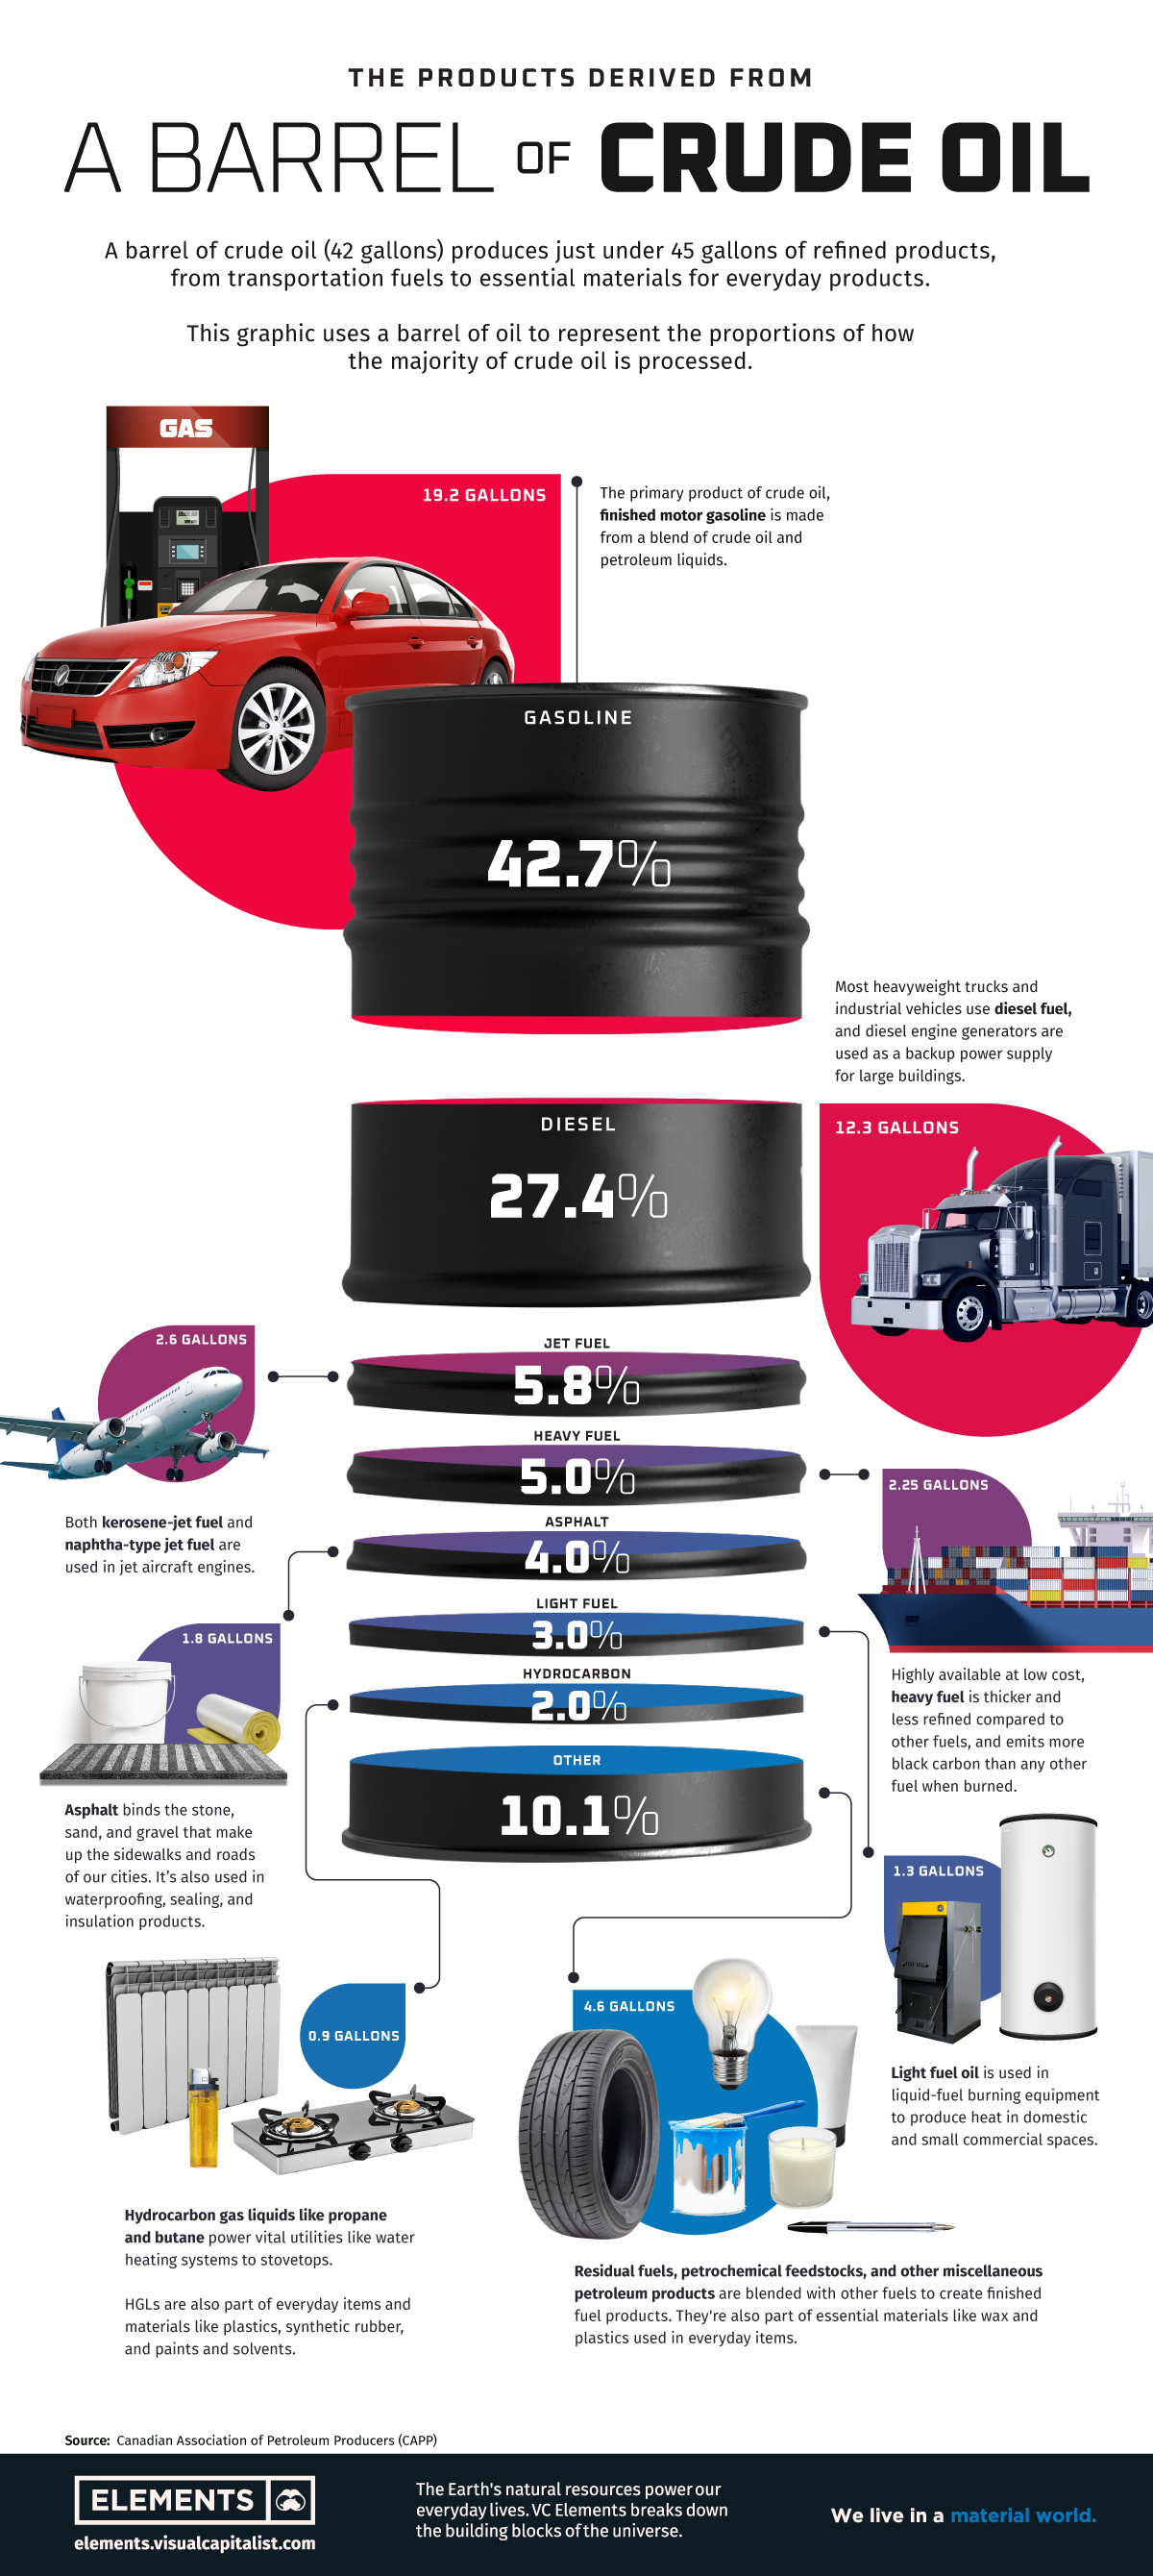
This graphic visualizes how much crude oil is refined into various finished products, using a barrel of oil to represent the proportional breakdown.
From Crude Oil to Functional Fuel and More 🔗
Crude oil is primarily refined into various types of fuels to power transport and vital utilities. More than 85% of crude oil is refined into fuels like gasoline, diesel, and hydrocarbon gas liquids (HGLs) like propane and butane.
Along with being fuels for transportation, heating, and cooking, HGLs are used as feedstock for the production of chemicals, plastics, and synthetic rubber, and as additives for motor gasoline production.
Refined Crude Oil Product
| Refined Crude Oil Product | Share of Crude Oil Refined |
|---|---|
| Gasoline | 42.70% |
| Diesel | 27.40% |
| Jet fuel | 5.80% |
| Heavy fuel | 5.00% |
| Asphalt | 4.00% |
| Light fuel | 3.00% |
| Hydrocarbon gas liquids | 2.00% |
| Other | 10.10% |
Crude oil not only powers our vehicles, but it also helps pave the roads we drive on. About 4% of refined crude oil becomes asphalt, which is used to make concrete and different kinds of sealing and insulation products.
Although transportation and utility fuels dominate a large proportion of refined products, essential everyday materials like wax and plastic are also dependent on crude oil. With about 10% of refined products used to make plastics, cosmetics, and textiles, a barrel of crude oil can produce a variety of unexpected everyday products.
Personal care products like cosmetics and shampoo are made using petroleum products, as are medical supplies like IV bags and pharmaceuticals. Modern life would look very different without crude oil.
What’s in one barrel of oil? 🔗
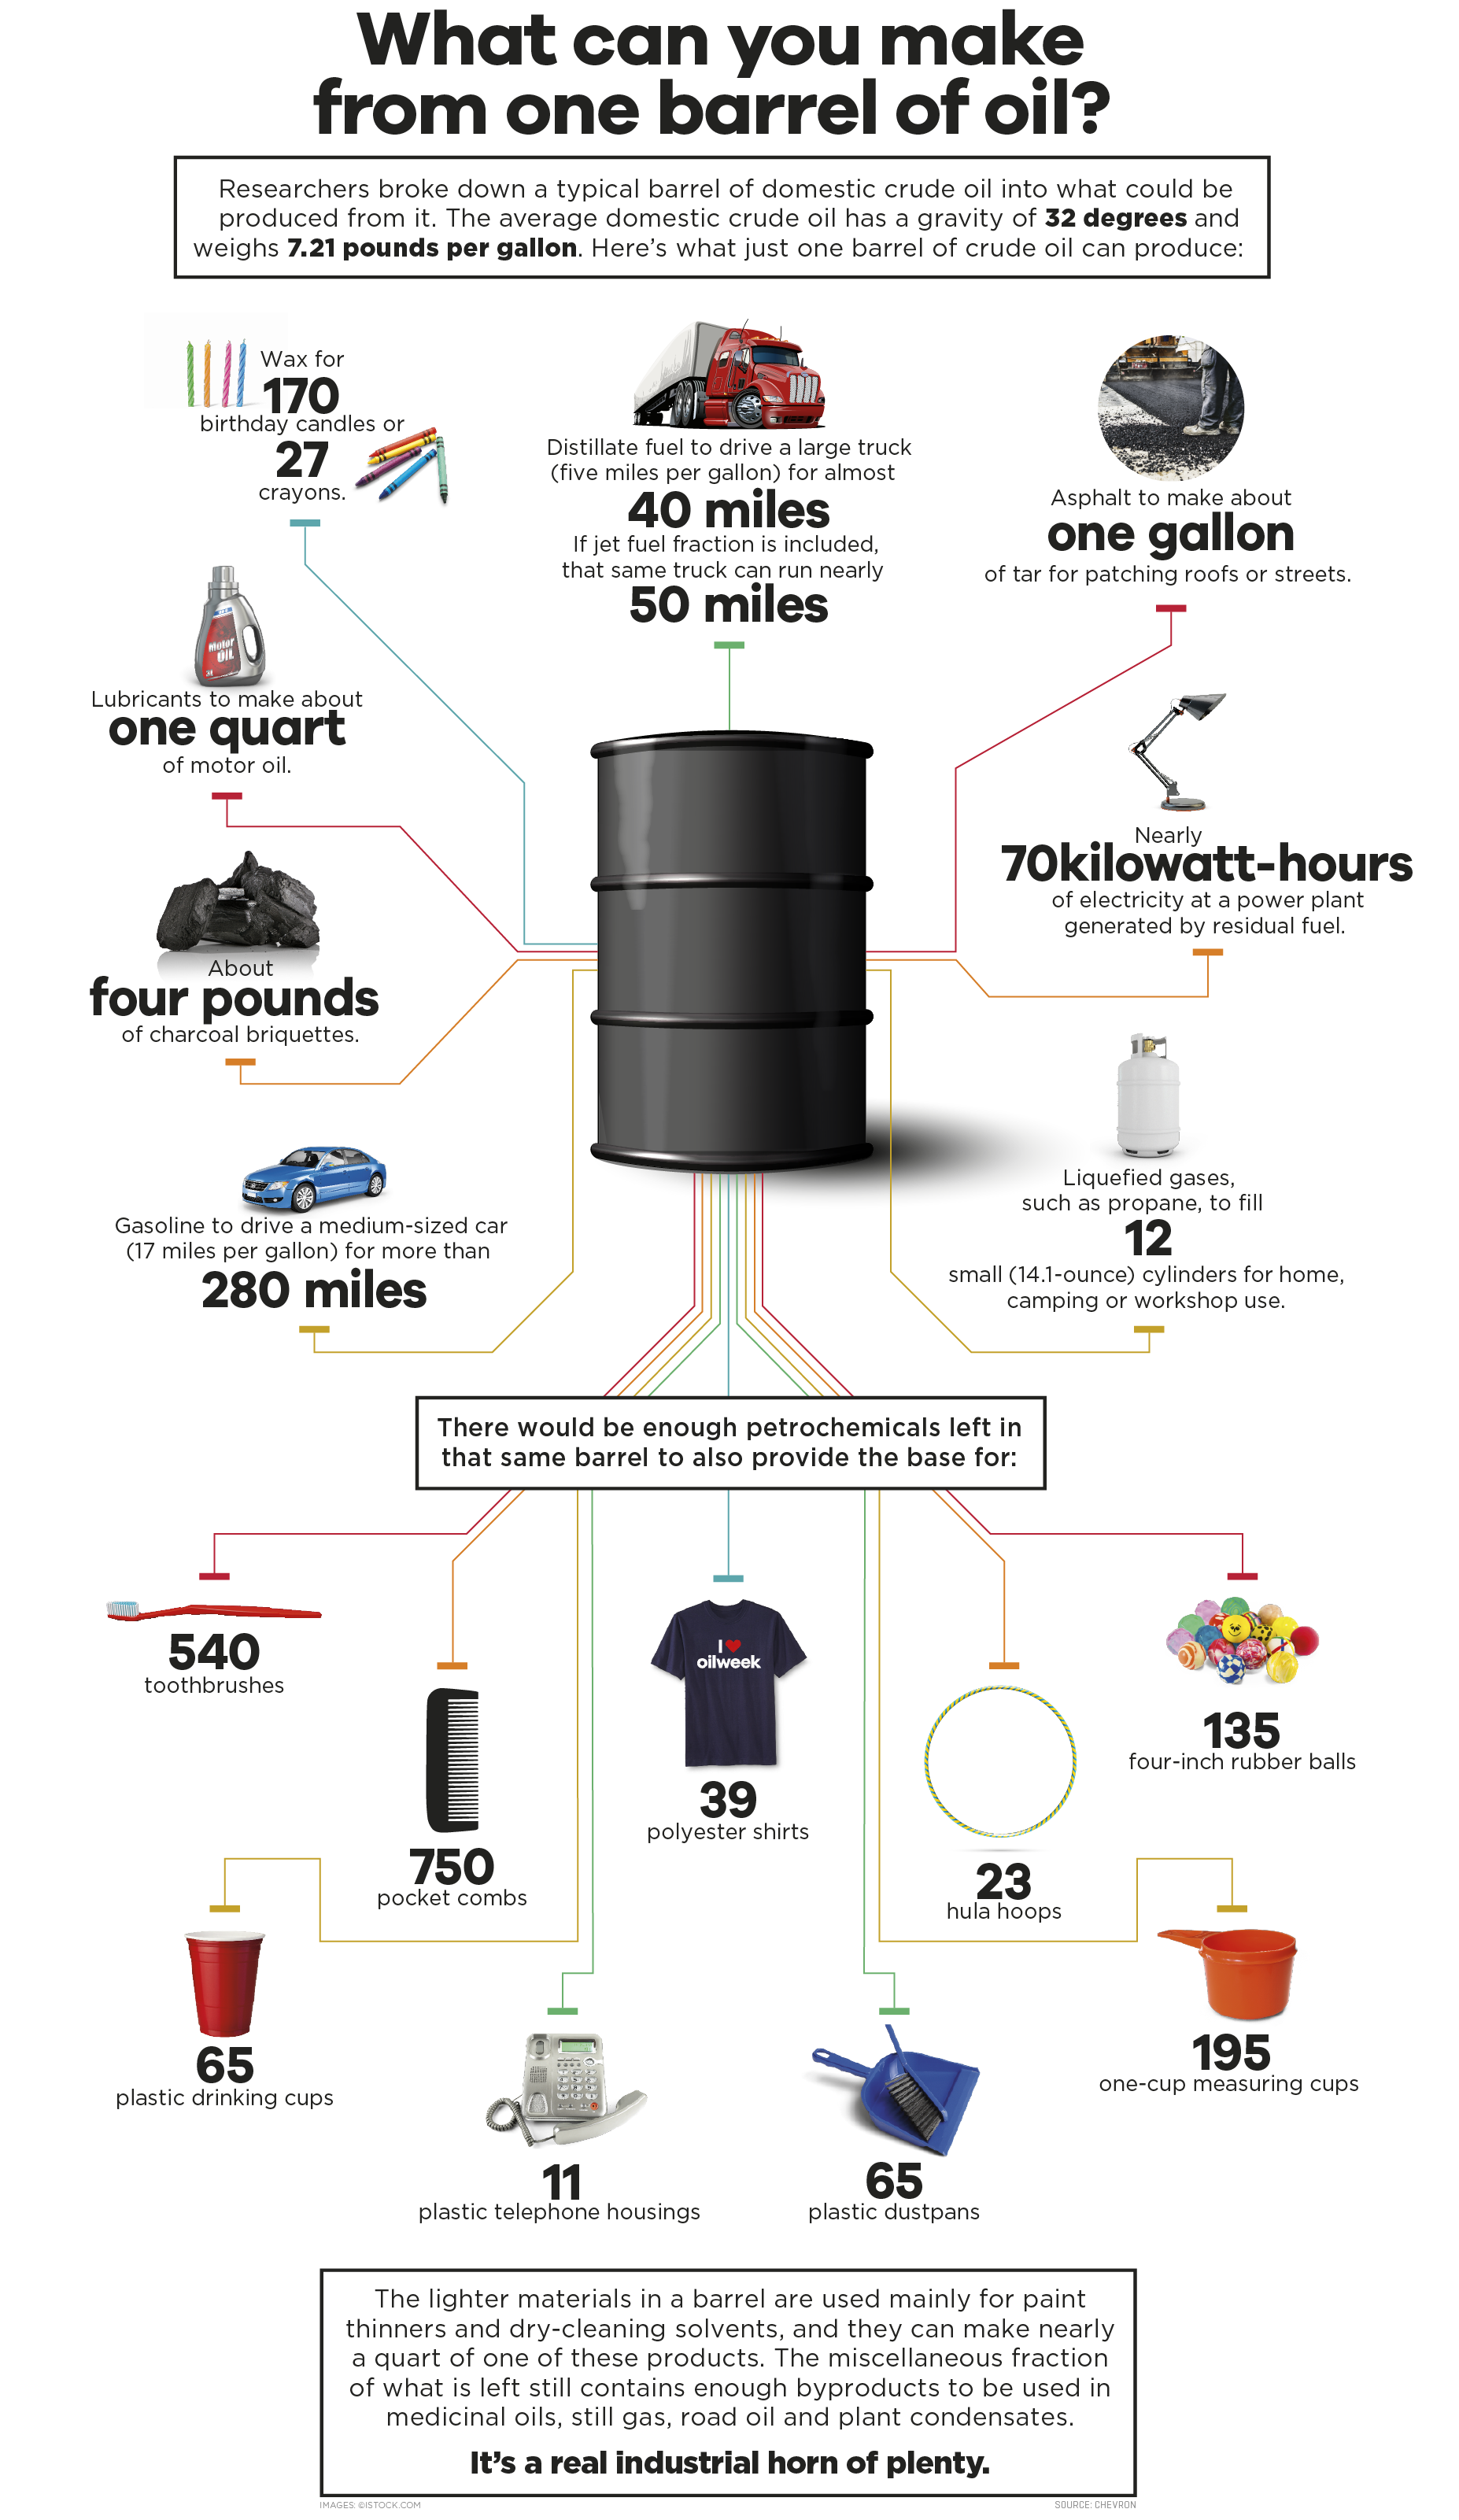
This infographic comes from JWN Energy, an oil and gas news site. Using Chevron as a source, it shows 17 different things that can be made from each barrel of oil.
Here is everything that can be made from just one barrel of oil:
- Enough gasoline to drive a medium-sized car over 450km (280 miles).
- Enough distillate fuel to drive a large truck for almost 65km (40 miles). If jet fuel fraction is included, that same truck can run nearly 80km (50 miles).
- Nearly 70 kWh of electricity at a power plant generated by residual fuel.
- About 1.8 kg (4 lbs) of charcoal briquettes.
- Enough propane to fill 12 small (14.1 ounce) cylinders for home, camping or workshop use.
- Asphalt to make about 3.8 L (one gallon) of tar for patching roofs or streets.
- Lubricants to make about a 0.95 L (one quart) of motor oil.
- Wax for 170 birthday candles or 27 wax crayons.
But that’s not all. After producing all of the above products, there’s also enough petrochemicals leftover to be used as a base for one of the following:
- 39 polyester shirts
- 750 pocket combs
- 540 toothbrushes
- 65 plastic dustpans
- 23 hula hoops
- 65 plastic drinking cups
- 195 one-cup measuring cups
- 11 plastic telephone housings
- 135 four-inch rubber balls
Oil is not a one-trick pony, and the gooey black liquid actually has thousands of applications. The above serves as one example of how a barrel could be used, but here’s a list of many other oil applications. It includes everything from guitar strings to antihistamines.
The Difficulty of Cutting Down on Crude Oil 🔗
From the burning of heavy fuels tarnishing icebergs found in Arctic waters to the mounds of plastic made with petrochemicals that end up in our rivers, crude oil and its refined products impact our environment in many different ways.
But even as the world works to reduce its consumption of fossil fuels in order to reach climate goals, a world without crude oil seems unfathomable.
Skyrocketing sales of EVs still haven’t managed to curb petroleum consumption in places like Norway, California, and China, and the steady reopening of travel and the economy will only result in increased petroleum consumption.
Completely replacing the multi-faceted “black gold” that is crude oil isn’t possible right now, but as electrification continues and we find alternatives to petrochemical materials, humanity might at least manage to reduce its dependence on burning fossil fuels.
Coal Power 🔗
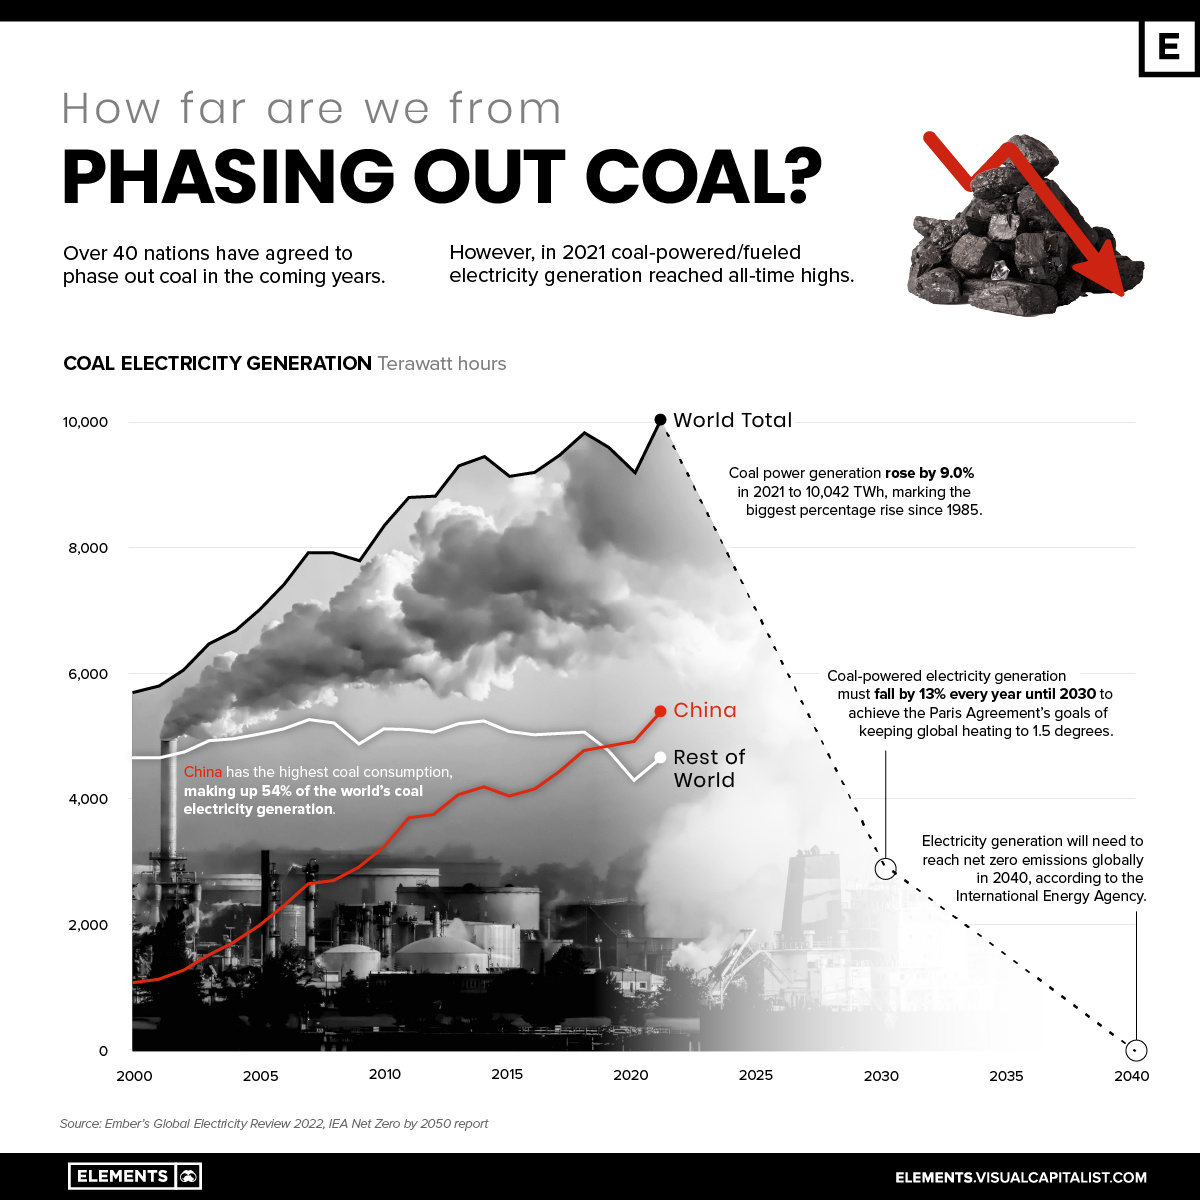
At the COP26 conference in October 2021, 40 nations agreed to phase coal out of their energy mixes.
Despite this, in 2021, coal-fired electricity generation reached all-time highs globally, showing that eliminating coal from the energy mix will not be a simple task.
This infographic shows the aggressive phase-out of coal power that would be required in order to reach net zero goals by 2050, based on an analysis by Ember that uses data provided by the International Energy Agency (IEA).
Low-Cost Comes at a High Environmental Cost 🔗
Coal-powered electricity generation rose by 9.0% in 2021 to 10,042 Terawatt-hours (TWh), marking the biggest percentage rise since 1985.
The main reason is cost. Coal is the world’s most affordable energy fuel. Unfortunately, low-cost energy comes at a high cost for the environment, with coal being the largest source of energy-related CO2</sub emissions.
China has the highest coal consumption, making up 54% of the world’s coal electricity generation. The country’s consumption jumped 12% between 2010 and 2020, despite coal making up a lower percentage of the country’s energy mix in relative terms.
Top Coal Consumers
| Top Consumers | 2020 Consumption (Exajoules) | Share of global consumption |
|---|---|---|
| China 🇨🇳 | 82.3 | 54.30% |
| India 🇮🇳 | 17.5 | 11.60% |
| United States 🇺🇸 | 9.2 | 6.10% |
| Japan 🇯🇵 | 4.6 | 3.00% |
| South Africa 🇿🇦 | 3.5 | 2.30% |
| Russia 🇷🇺 | 3.3 | 2.20% |
| Indonesia 🇮🇩 | 3.3 | 2.20% |
| South Korea 🇰🇷 | 3 | 2.00% |
| Vietnam 🇻🇳 | 2.1 | 1.40% |
| Germany 🇩🇪 | 1.8 | 1.20% |
Together, China and India account for 66% of global coal consumption and emit about 35% of the world’s greenhouse gasses (GHG). If you add the United States to the mix, this goes up to 72% of coal consumption and 49% of GHGs.
How Urgent is to Phase Out Coal? 🔗
According to the United Nations, emissions from current and planned fossil energy infrastructure are already more than twice the amount that would push the planet over 1.5°C of global heating, a level that scientists say could bring more intense heat, fire, storms, flooding, and drought than the present 1.2°C.
Apart from being the largest source of CO2</sub emissions, coal combustion is also a major threat to public health because of the fine particulate matter released into the air.
As just one example of this impact, a recent study from Harvard University estimates air pollution from fossil fuel combustion is responsible for 20% deaths globally.
The Move to Renewables 🔗
Coal-powered electricity generation must fall by 13% every year until 2030 to achieve the Paris Agreement’s goals of keeping global heating to only 1.5 degrees.
To reach the mark, countries would need to speed up the shift from their current carbon-intensive pathways to renewable energy sources like wind and solar.
How fast the transition away from coal will be achieved depends on a complicated balance between carbon emissions cuts and maintaining economic growth, the latter of which is still largely dependent on coal power.
Five Major Types of Renewable Energy 🔗
Awareness around climate change is shaping the future of the global economy in several ways.
Governments are planning how to reduce emissions, investors are scrutinizing companies’ environmental performance, and consumers are becoming conscious of their carbon footprints. But no matter the stakeholder, energy generation and consumption from fossil fuels is one of the biggest contributors to emissions.
Therefore, renewable energy sources have never been more top-of-mind than they are today.
Renewable energy technologies harness the power of the sun, wind, and heat from the Earth’s core, and then transforms it into usable forms of energy like heat, electricity, and fuel.
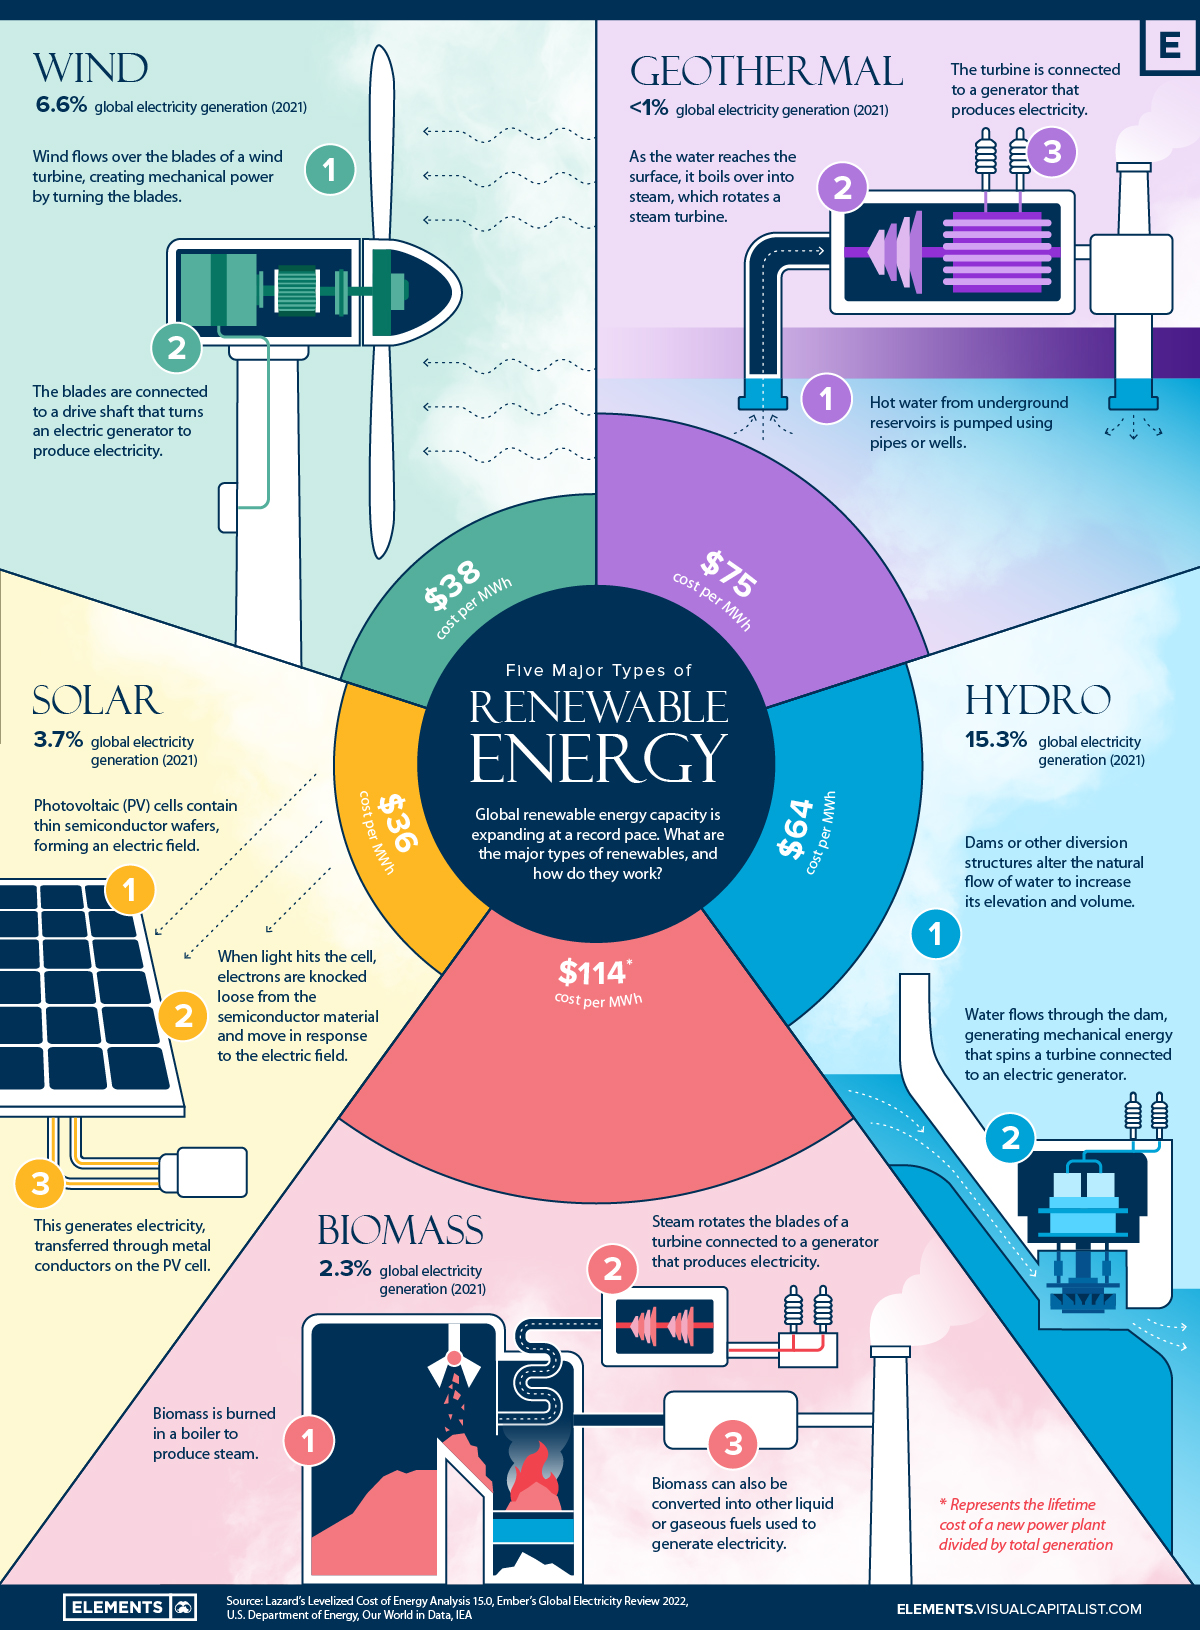
The above infographic uses data from Lazard, Ember, and other sources to outline everything you need to know about the five key types of renewable energy:
Types of Renewable Energy
| Energy Source | % of 2021 Global Electricity Generation | Avg. levelized cost of energy per MWh |
|---|---|---|
| Hydro💧 | 15.30% | $64 |
| Wind🌬💨 | 6.60% | $38 |
| Solar☀️ | 3.70% | $36 |
| Biomass🌳 | 2.30% | $114 |
| Geothermal♨️ | <1% | $75 |
Though often out of the limelight, hydro is the largest renewable electricity source, followed by wind and then solar.
Together, the five main sources combined for roughly 28% of global electricity generation in 2021, with wind and solar collectively breaking the 10% share barrier for the first time.
The levelized cost of energy (LCOE) measures the lifetime costs of a new utility-scale plant divided by total electricity generation. The LCOE of solar and wind is almost one-fifth that of coal ($167/MWh), meaning that new solar and wind plants are now much cheaper to build and operate than new coal plants over a longer time horizon.
With this in mind, here’s a closer look at the five types of renewable energy and how they work.
Wind 🔗
Wind turbines use large rotor blades, mounted at tall heights on both land and sea, to capture the kinetic energy created by wind.
When wind flows across the blade, the air pressure on one side of the blade decreases, pulling it down with a force described as the lift. The difference in air pressure across the two sides causes the blades to rotate, spinning the rotor.
The rotor is connected to a turbine generator, which spins to convert the wind’s kinetic energy into electricity.
Solar (Photovoltaic) 🔗
Solar technologies capture light or electromagnetic radiation from the sun and convert it into electricity.
Photovoltaic (PV) solar cells contain a semiconductor wafer, positive on one side and negative on the other, forming an electric field. When light hits the cell, the semiconductor absorbs the sunlight and transfers the energy in the form of electrons. These electrons are captured by the electric field in the form of an electric current.
A solar system’s ability to generate electricity depends on the semiconductor material, along with environmental conditions like heat, dirt, and shade.
Geothermal 🔗
Geothermal energy originates straight from the Earth’s core — heat from the core boils underground reservoirs of water, known as geothermal resources.
Geothermal plants use (open or closed loop) wells to pump hot water from geothermal resources and convert it into steam for a turbine generator. The extracted water and steam can then be reinjected, making it a renewable energy source.
Hydropower 🔗
Similar to wind turbines, hydropower plants channel the kinetic energy from flowing water into electricity by using a turbine generator.
Hydro plants are typically situated near bodies of water and use diversion structures like dams to change the flow of water. Power generation depends on the volume and change in elevation or head of the flowing water.
Greater water volumes and higher heads produce more energy and electricity, and vice versa.
Biomass 🔗
Humans have likely used energy from biomass or bioenergy for heat ever since our ancestors learned how to build fires.
Biomass — organic material like wood, dry leaves, and agricultural waste — is typically burned but considered renewable because it can be regrown or replenished. Burning biomass in a boiler produces high-pressure steam, which rotates a turbine generator to produce electricity.
Biomass is also converted into liquid or gaseous fuels for transportation. However, emissions from biomass vary with the material combusted and are often higher than other clean sources. This is the least cost efficient and the most wasteful of the options as it often involves clear-cutting forest for fuel.
When Will Renewable Energy Take Over? 🔗
Despite the recent growth of renewables, fossil fuels still dominate the global energy mix.
Most countries are in the early stages of the energy transition, and only a handful get significant portions of their electricity from clean sources. However, the ongoing decade might see even more growth than recent record-breaking years.
The IEA forecasts that, by 2026, global renewable electricity capacity is set to grow by 60% from 2020 levels to over 4,800 gigawatts — equal to the current power output of fossil fuels and nuclear combined. So, regardless of when renewables will take over, it’s clear that the global energy economy will continue changing.
Conclusions 🔗
While I don’t believe we can 100% eliminate the use of fossil fuels (oil), we must urgently reduce our reliance on it for travel (e.g. cars, buses, planes, trains, and heating homes). Furthermore, we shouldn’t be subsidizing the oil industry. Yes, it will hurt in the beginning, but that pain will encourage our rollout of better solutions at a faster pace. Something we urgently need at this point.
With regards to renewable energy sources, I’m disappointed we haven’t invested more in geothermal energy. It’s a great way to keep all those mining & drilling companies employed as we continue to transition away from non-renewable sources. As long as they are installing closed-loop systems, there’s virtually no risk of triggering earthquakes. Iceland has proven this to be a very viable and cost effective solution. Plus, unlike wind & solar, it operates 24x7.
While Oil companies have every profit incentive to keep business as usual, they are consuming a planet with finite (limited) resources. We only have one planet. (And, Elon Musk’s SpaceX won’t save us…) Collectively, we must do every little bit to make it count.
References 🔗
- https://www.visualcapitalist.com/charted-5-trillion-in-fossil-fuel-subsidies/
- https://elements.visualcapitalist.com/visualizing-the-products-and-fuels-made-from-crude-oil/
- https://www.visualcapitalist.com/can-made-one-barrel-oil/
- https://www.visualcapitalist.com/how-far-from-phasing-out-coal-power/
- https://elements.visualcapitalist.com/what-are-the-five-major-types-of-renewable-energy/
