Visualizing The World’s Loss of Forests Since the Ice-Age 🔗
How much of Earth used to be covered by forests, and what portion is covered today?
The effects of deforestation on the climate are already being seen and felt, and these repercussions are expected to increase with time. That’s why more than 100 world leaders pledged to end and reverse deforestation by 2030 at the COP26 climate summit.
As today’s graphic using data from Our World in Data highlights, the world’s forests have been shrinking since the last ice age at an increasingly rapid pace.
Earth’s Surface Area: 10,000 Years Ago 🔗
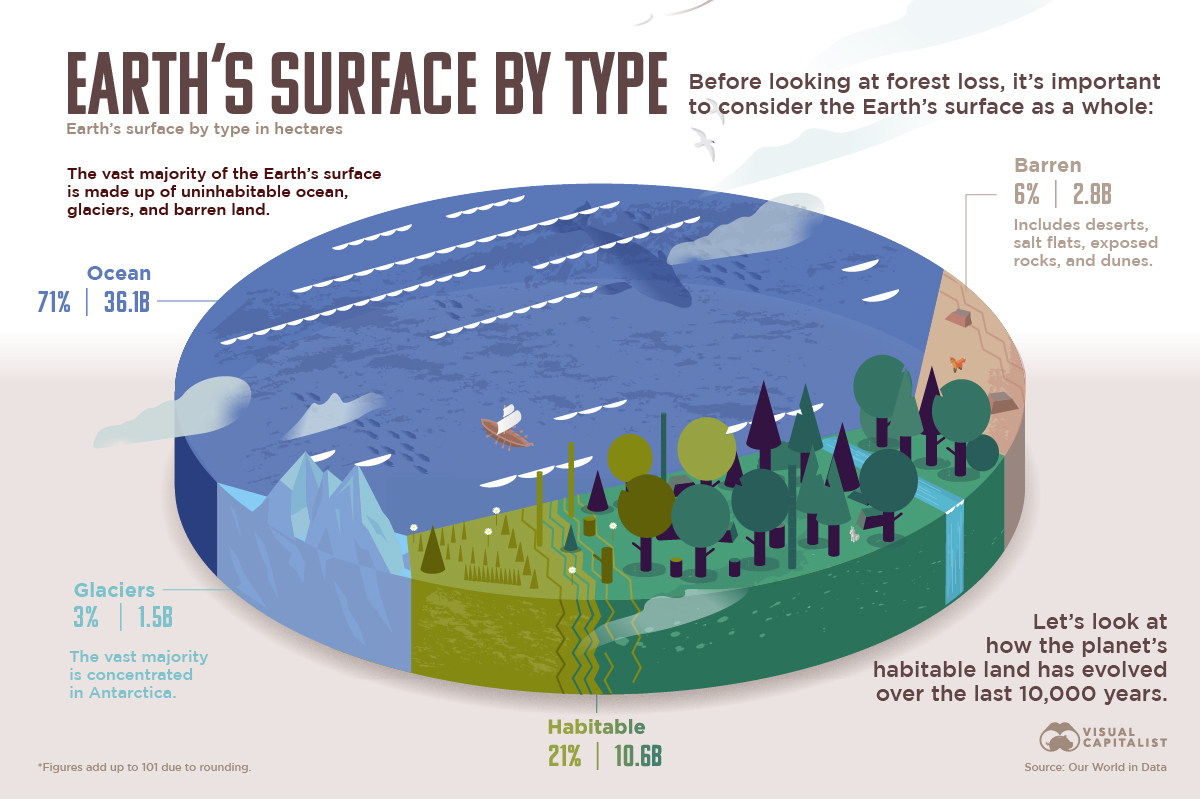
To examine the deforestation situation properly, it helps to understand Earth’s total available surface area. After all, our world can feel massive when glancing at maps or globes. But of the roughly 51 billion hectares in total surface area on Earth, more than 70% is taken up by oceans.
What’s left is 14.9 billion hectares of land, not all of which is habitable. Here is how the land was allocated 10,000 years ago, after the last ice age and before the rise of human civilizations.
Uninhabitable land on Earth (10,000 years ago):
- Barren land (19% or 2.8bn ha)—Includes deserts, salt flats, exposed rocks, and dunes
- Glaciers (10% or 1.5bn ha)—The vast majority concentrated in Antarctica
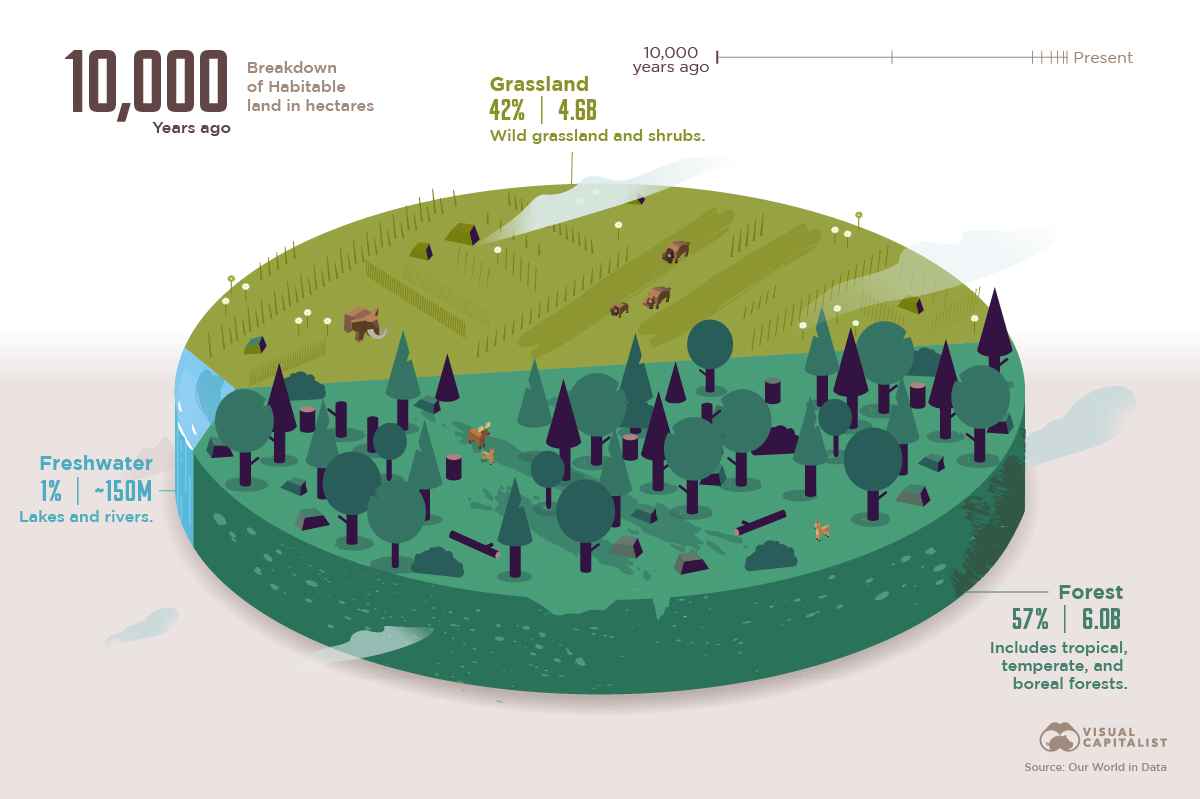
Habitable land on Earth (10,000 years ago):
- Forest (57% or 6bn ha)—Includes tropical, temperate, and boreal forests
- Grassland (42% or 4.6bn ha)—Wild grassland and shrubs
- Freshwater (1% or <510M ha)—Lakes and rivers
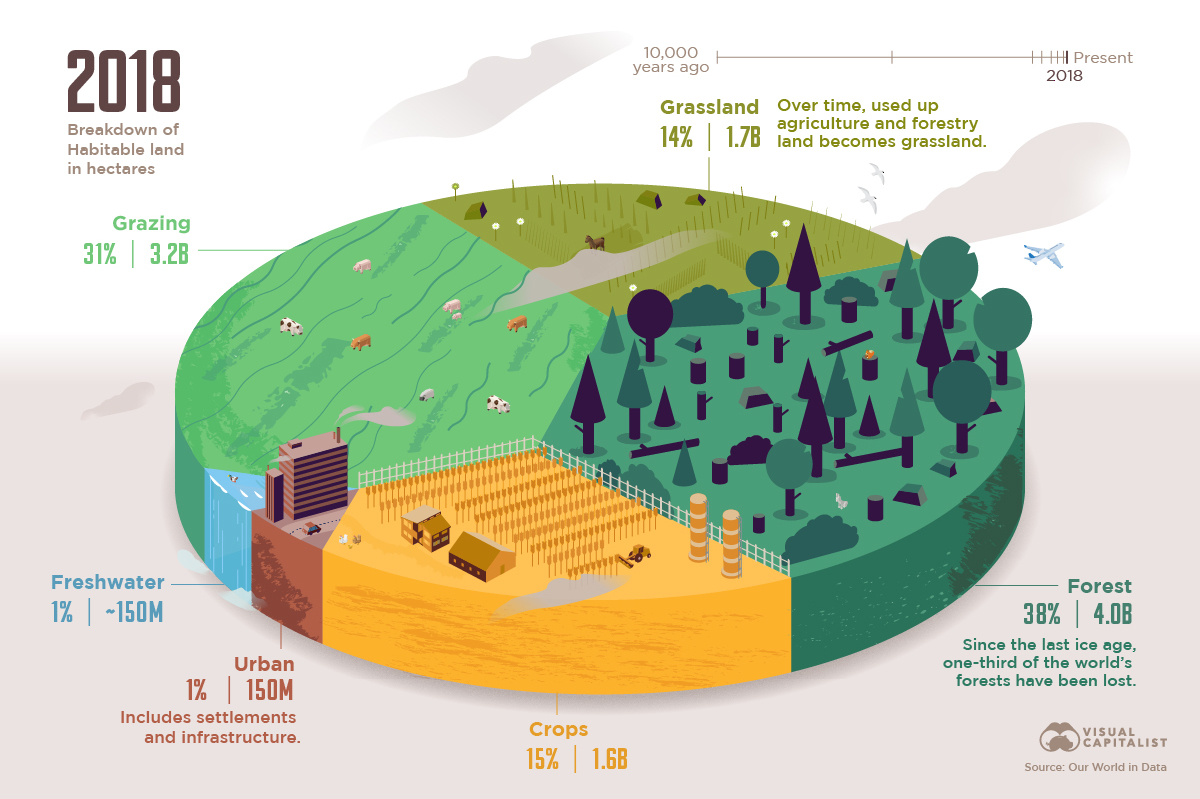
By 2018, forests had receded to just 4 billion hectares. What happened?
Forests and Grassland Recede for Agriculture 🔗
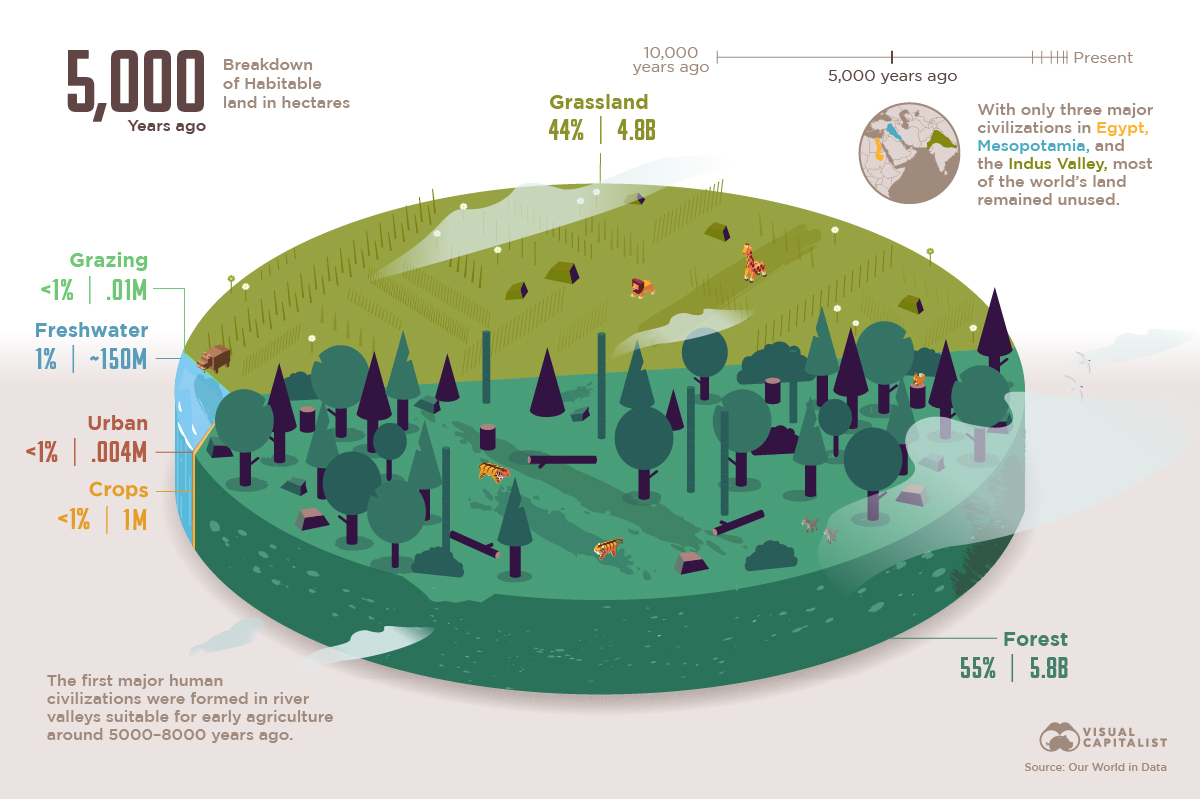
Once humans figured out how to cultivate plants and livestock for regular sources of food, they needed land to use.
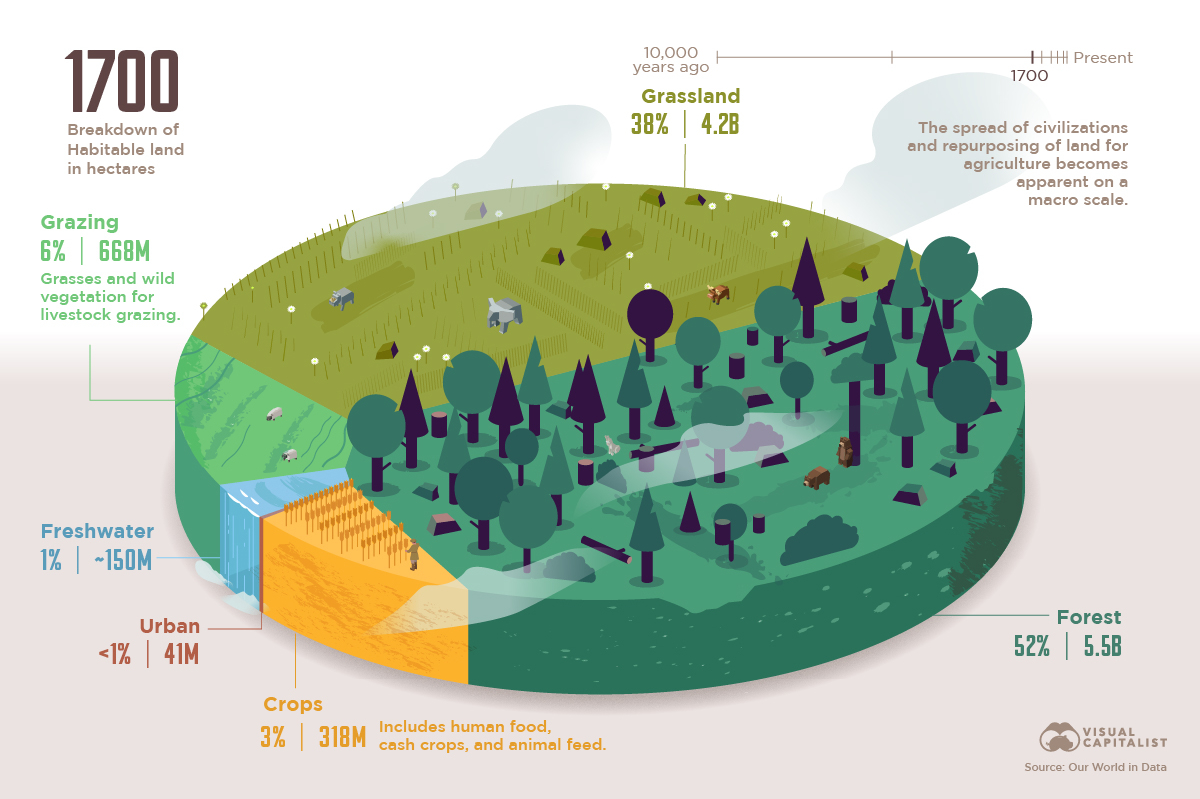
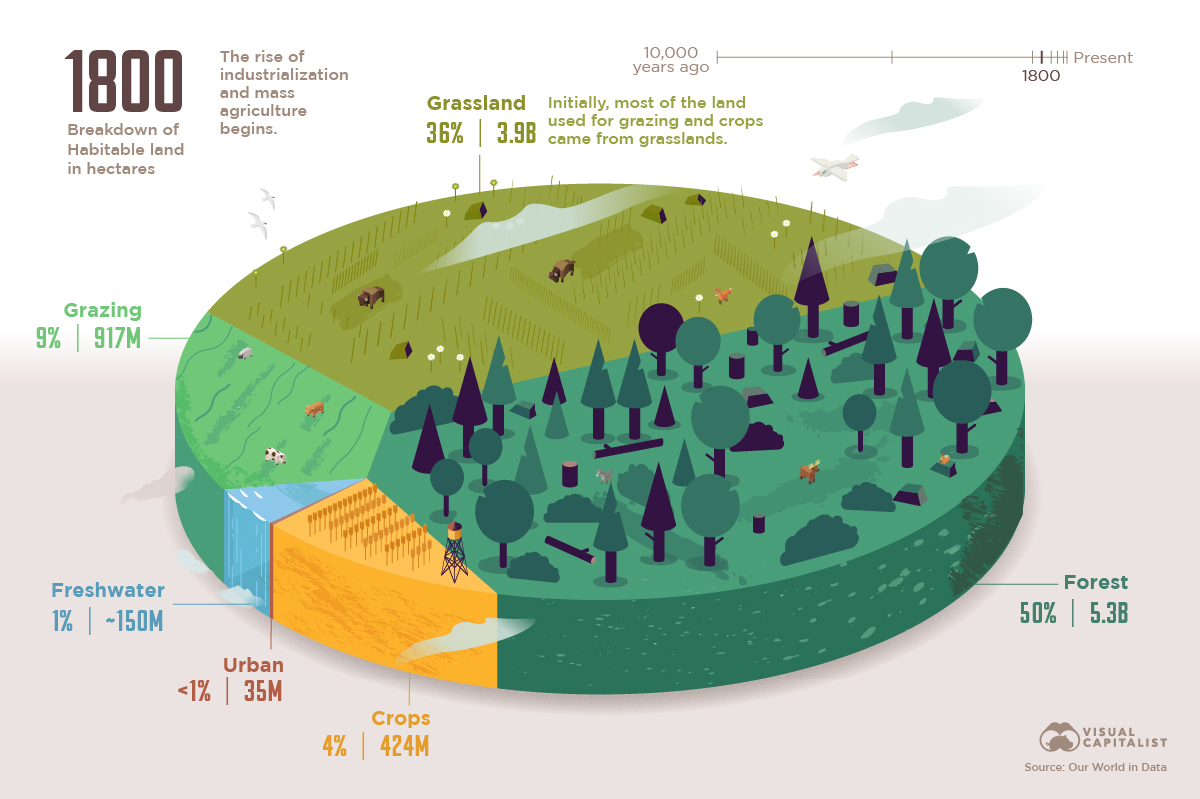
For centuries, the loss of greenery was relatively slow. By 1800, the world had lost 700 million hectares each of forest and grassland, replaced by around 900 million hectares of land for grazing animals and 400 million hectares for crops.
But industrialization in the 1800s rapidly sped up the process.
| Percentage of Habitable Land by year | 1700 | 1800 | 1900 | 1950 | 2018 |
|---|---|---|---|---|---|
| Forest | 52% | 50% | 48% | 44% | 38% |
| Grassland | 38% | 36% | 27% | 12% | 14% |
| Grazing | 6% | 9% | 16% | 31% | 31% |
| Crops | 3% | 4% | 8% | 12% | 15% |
| Freshwater | 1% | 1% | 1% | 1% | 1% |
| Urban | <1% | <1% | <1% | <1% | 1% |
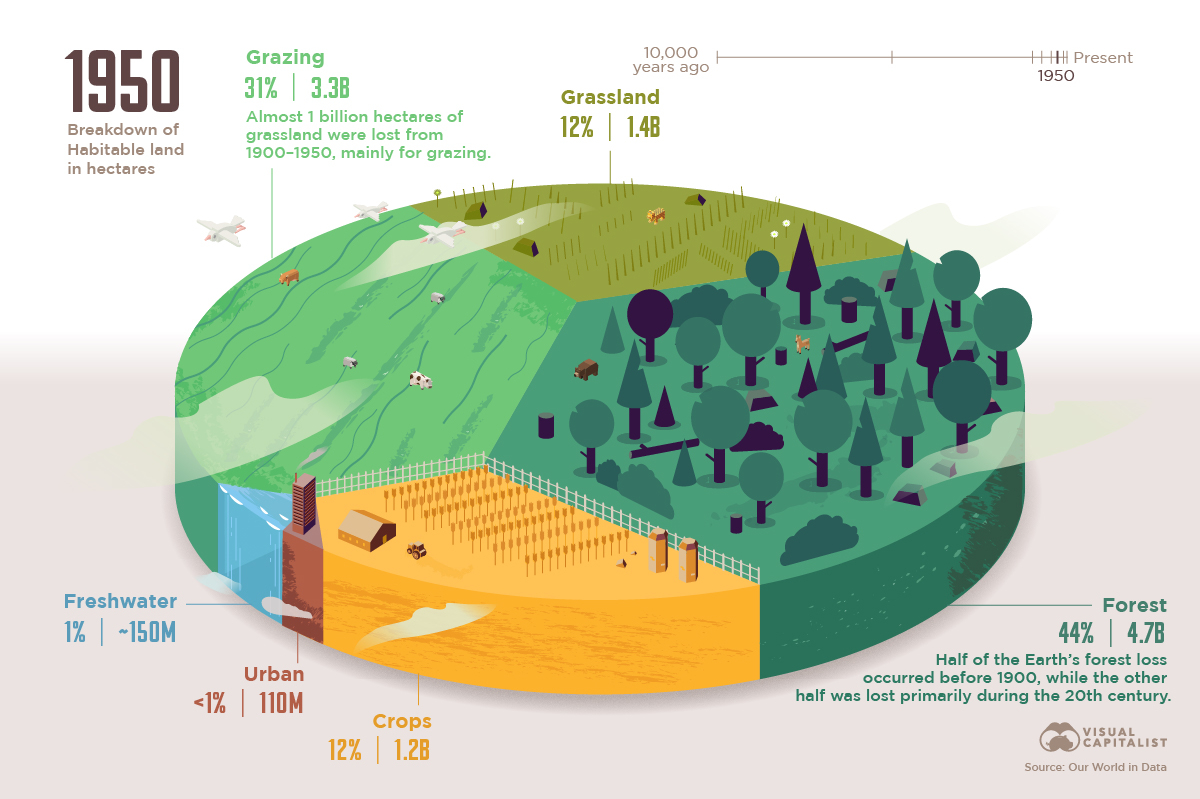
While half of Earth’s loss of forests occurred from 10,000 years ago to 1900, the other half or 1.1 billion hectares have been lost since 1900. Part of this loss, about 100 million hectares, has occurred in the more recent time period of 2000 to 2018.
The biggest culprit?
Though urban land use has rapidly grown, it still pales in comparison to the 31% of habitable land now being used for grazing livestock. Most of that land came at first from repurposed grasslands, but forests have also been cleared along the way.
Where Will Food Come From? 🔗
Countries pledging to stop deforestation have two major hurdles to solve: financial and survival.
Firstly, there are many companies, jobs, and economies that rely on producing and marketing goods made from forests, such as lumber.
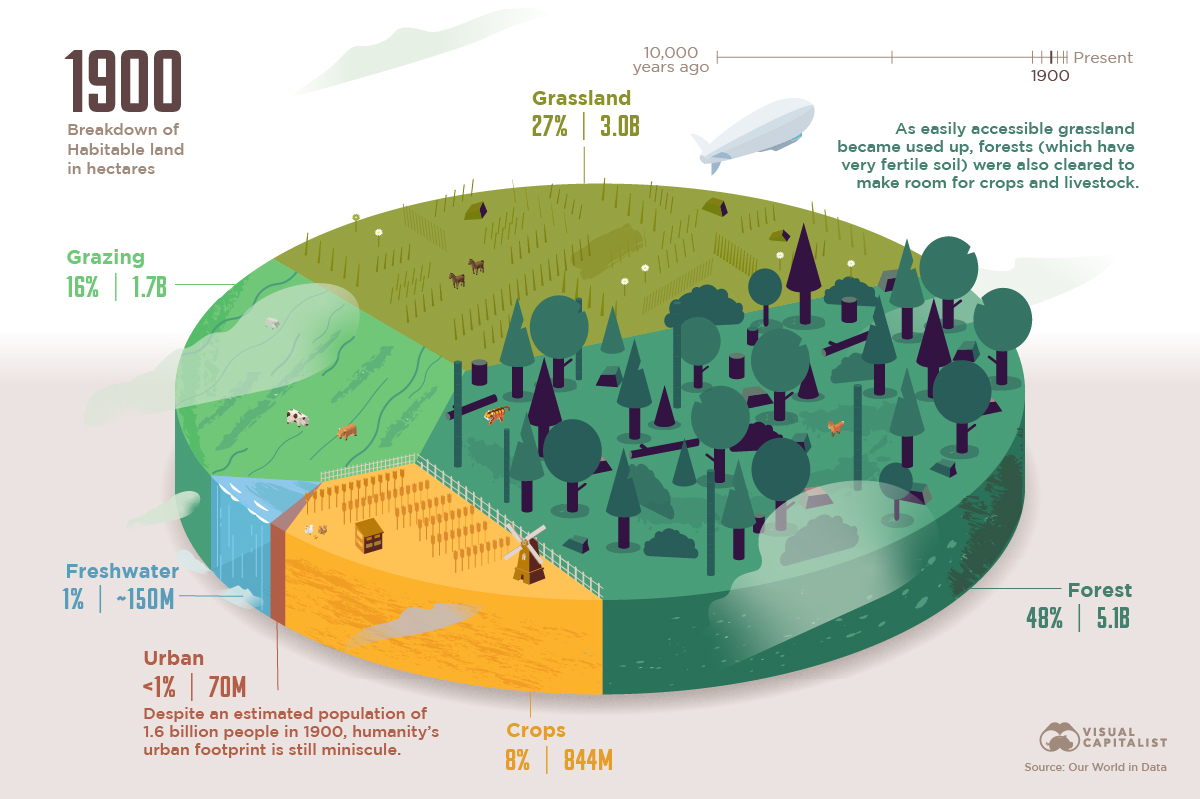
But more importantly, the world’s rising use of land for crops and agriculture reflects our rapidly growing population. In 1900, the global population numbered just 1.6 billion people. By 2021, it had exceeded 7.9 billion, with hundreds of millions still affected by food shortages every day.
How do you feed so many without needing more land? Meat’s extremely large footprint makes prioritizing crops more attractive, and research into other solutions like lab-grown meat and grazing erosion prevention is ongoing.
As the effects of climate change become increasingly felt, it’s likely that countries, companies, and people will have to embrace many different solutions at once.
Infographics 🔗