
Sometimes we use indicators without knowing that they have more potential than they show. For example, the RSI is only used in one or two ways but there are a lot of techniques that you can apply on the RSI. This article presents a forgotten way of using the RSI.
Relative Strength Index 🔗
First introduced by J. Welles Wilder Jr., the RSI is one of the most popular and versatile technical indicators. Mainly used as a contrarian indicator where extreme values signal a reaction that can be exploited. Typically, we use the following steps to calculate the default RSI:
Calculate the change in the closing prices from the previous ones.
Separate the positive net changes from the negative net changes.
Calculate a smoothed moving average on the positive net changes and on the absolute values of the negative net changes.
Divide the smoothed positive changes by the smoothed negative changes. We will refer to this calculation as the Relative Strength — RS.
Apply the normalization formula shown below for every time step to get the RSI.
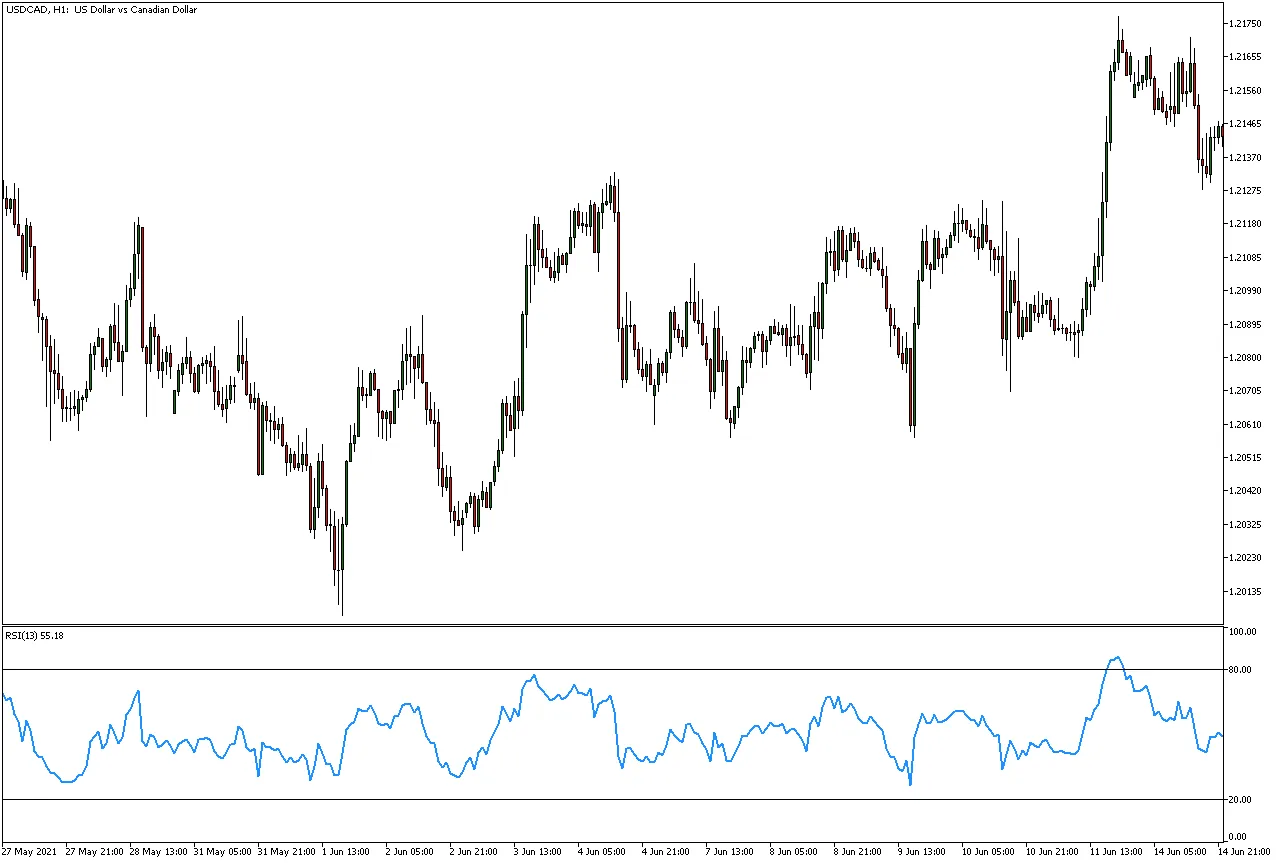
The above chart shows the hourly values of USDCAD with the 13-period RSI. As the RSI is bounded between 0 and 100, extreme values tend to be associated with market reactions. The most common extreme levels (which are called overbought and oversold levels) are 30 and 70, however, other levels are used such as 25 and 75, or even 20 and 80.
Generally, traders use the RSI to confirm a reversal bias. The trading conditions are therefore:
- A long (buy) bias appears whenever the 13-period RSI is close to 20 as market participants think that the market is oversold. This is of course more complex in real life.
- A short (sell) bias appears whenever the 13-period RSI is close to 80 as market participants think that the market is overbought. In reality, the back-tests prove that there is little value to this technique.
In the original book where the RSI has been introduced, the author spoke of a way that we can use the RSI but it is not commonly applied today due to its subjective nature. This way is the act of applying classical price patterns on the RSI.
This article will show how to find signals from a very known pattern called the head and shoulders.
Check out my weekly market sentiment report to understand the current positioning and to estimate the future direction of several major markets through complex and simple models working side by side. Find out more about the report through this link that covers the analysis between 07/08/2022 and 14/08/2022:

Applying the Head & Shoulders Pattern on the RSI 🔗
The head and shoulders pattern is a bearish reversal configuration that appears as 3 tops where the middle top is higher than the first and the last top. Take a look at the below chart to see how we have identified a head and shoulders pattern on the RSI which in turn correctly predicted the market’s direction afterwards.
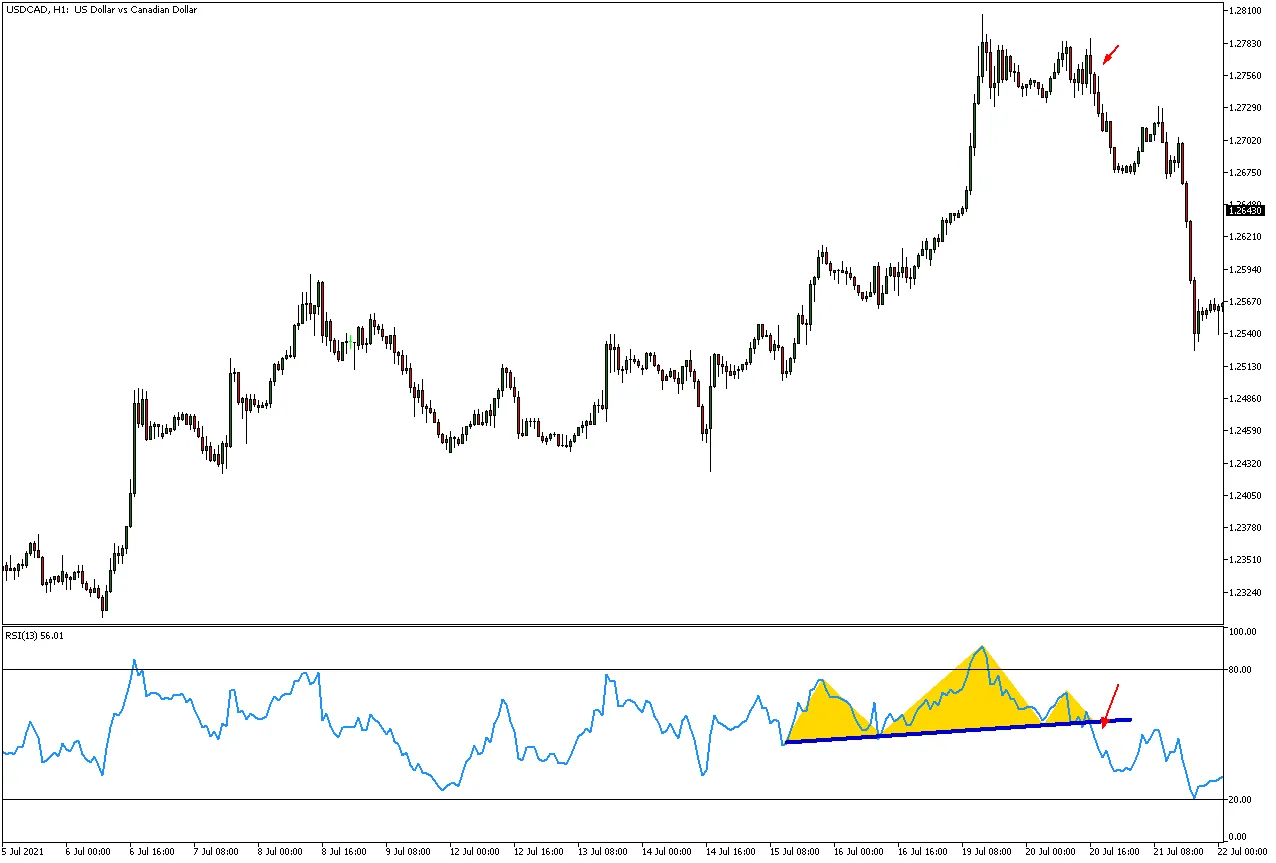
Basically, we should look for an RSI that is not far from the overbought zone (or above 50 at least). Then, we wait for the formation of the three tops on the condition that the middle top slightly touches or surpasses 80 (the overbought level). Whenever the neckline (line in blue) is broken, the bearish signal is validated.
The inverted head and shoulders pattern is a bullish reversal configuration that appears as 3 bottoms where the middle bottom is lower than the first and the last bottom. Take a look at the below chart to see how we have identified an inverted head and shoulders pattern.
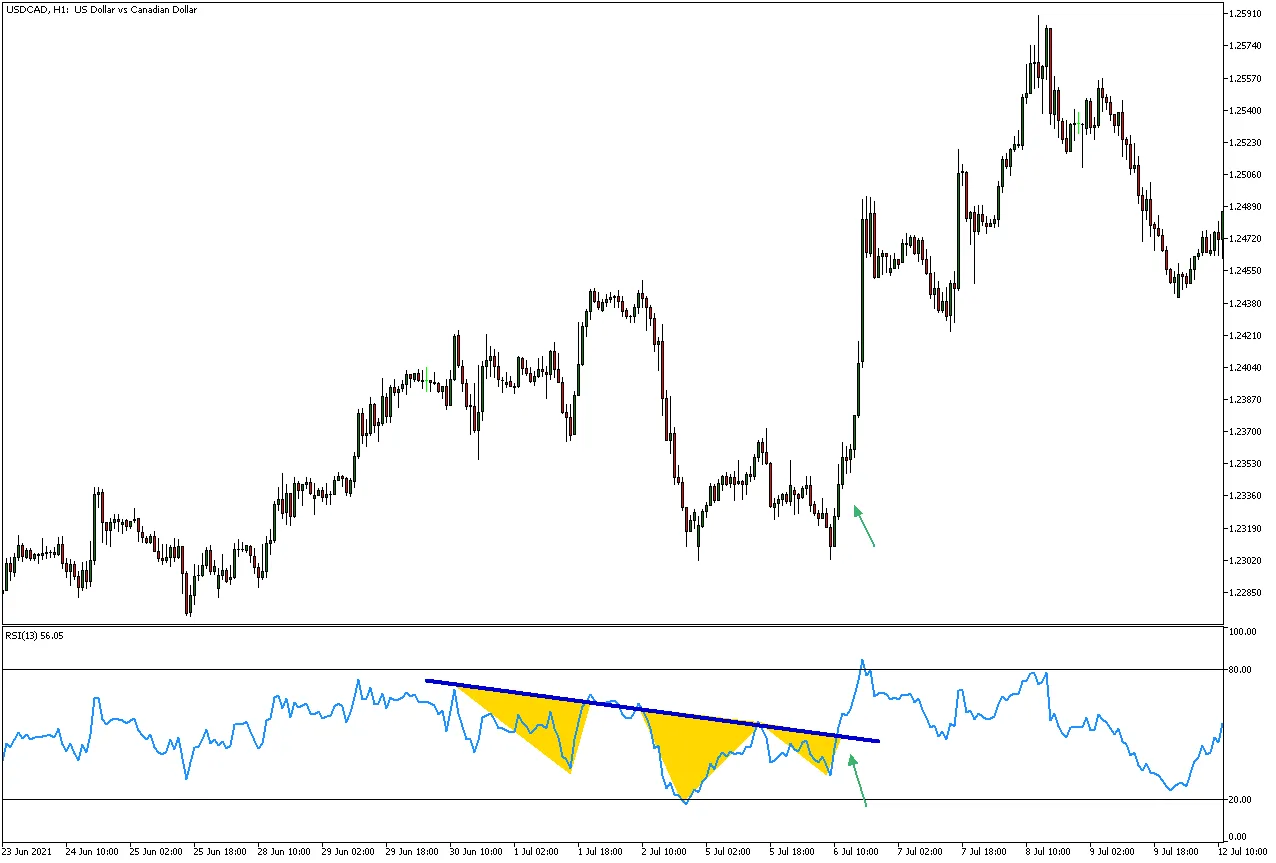
Basically, we should look for an RSI that is not far from the oversold zone (or below 50 at least). Then, we wait for the formation of the three bottoms on the condition that the middle bottom slightly touches or breaks 20 (the oversold level). Whenever the neckline (line in blue) is surpassed, the bullish signal is validated.
The next chart shows an example of two successive patterns that showed good reactions.
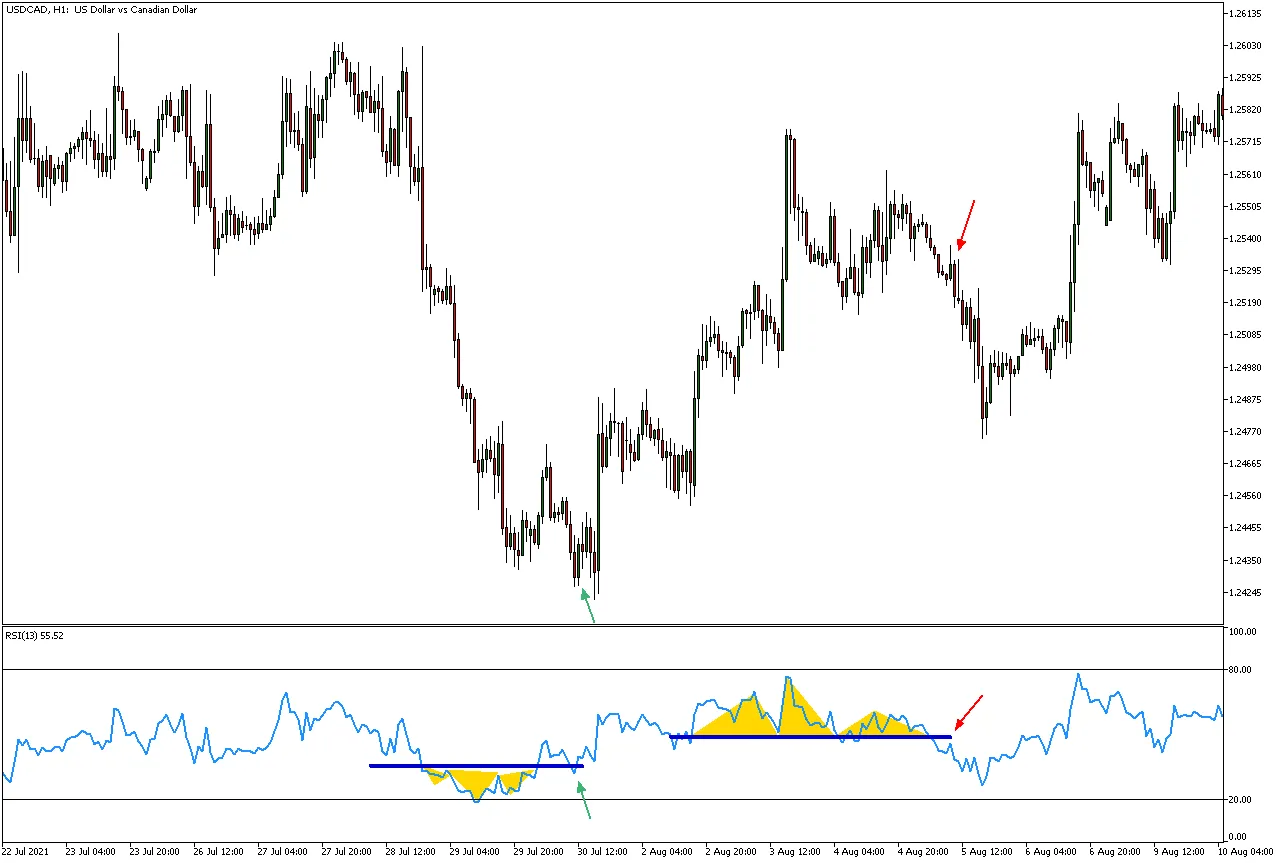
The issue that remains is that the pattern is subjective in nature and does not have clear conditions.
If you want to see how to create all sorts of algorithms yourself, feel free to check out Lumiwealth. From algorithmic trading to blockchain and machine learning, they have hands-on detailed courses that I highly recommend.
Summary 🔗
To sum up, what I am trying to do is to simply contribute to the world of objective technical analysis which is promoting more transparent techniques and strategies that need to be back-tested before being implemented. This way, technical analysis will get rid of the bad reputation of being subjective and scientifically unfounded.
I recommend you always follow the the below steps whenever you come across a trading technique or strategy:
- Have a critical mindset and get rid of any emotions.
- Back-test it using real life simulation and conditions.
- If you find potential, try optimizing it and running a forward test.
- Always include transaction costs and any slippage simulation in your tests.
- Always include risk management and position sizing in your tests.
Finally, even after making sure of the above, stay careful and monitor the strategy because market dynamics may shift and make the strategy unprofitable.